Mobile Monitoring · CORAL
Water quality, water level and rainfall monitoring
We monitor water quality, water level and rainfall. Water quality monitoring is carried out together with our partner company Mobile Monitoring: its smart buoys monitor continuously and surface drones map how pollution spreads across a water body. Both companies work on the shared CORAL platform. The data reaches it in real time, and the platform notifies you of every exceedance.
Water in a port or plant: three different questions
The first question: what is the water quality, and did anything change after a discharge, a quay repair or an algal bloom. The second: how much water there is, meaning the level in a river, canal or reservoir and whether it is approaching an alarm stage. The third: how much rain fell, because stormwater fees and the drainage system depend on it. Each question is answered by a different device, but the data ends up in one place.
Water quality: together with Mobile Monitoring
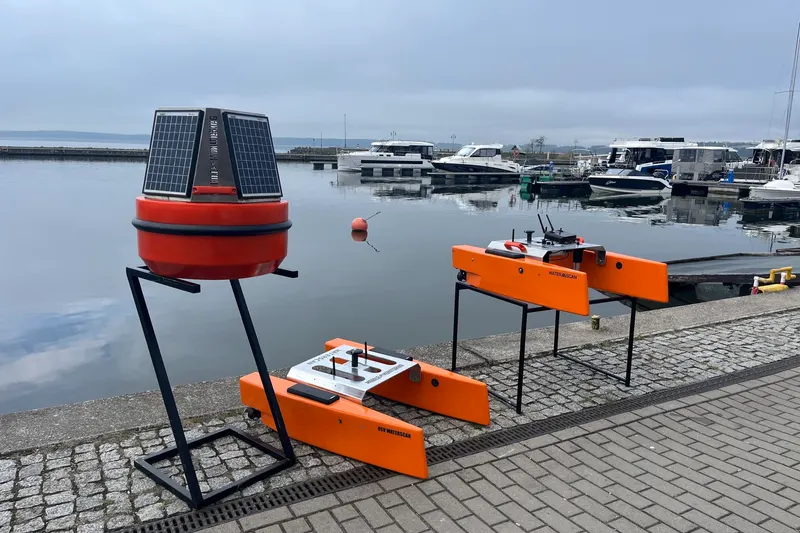
We monitor water quality together with Mobile Monitoring, a partner company we work with on the same CORAL platform. Mobile Monitoring supplies and operates the devices on the water, and SeaData provides the platform, data analysis and notifications.
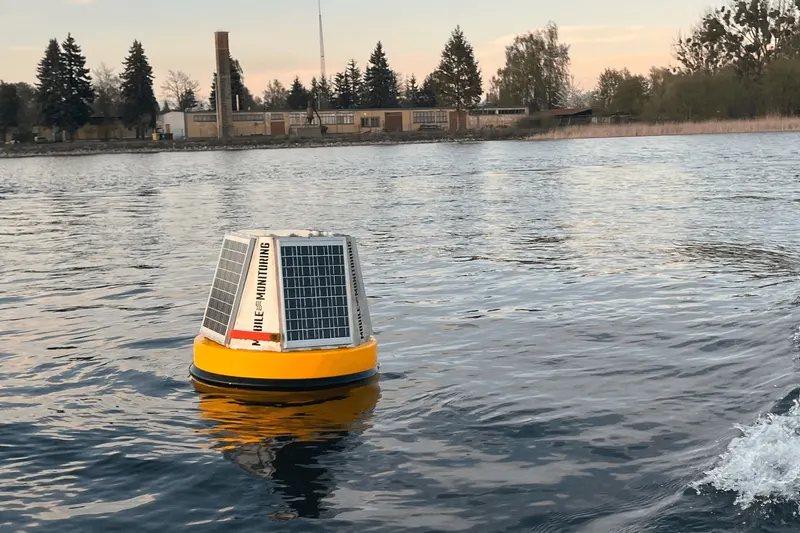
A monitoring buoy works at one point without a break. It is the right choice where continuity matters: in a port basin, at a water intake, at a bathing site. It runs on a solar panel and sends data over LTE.
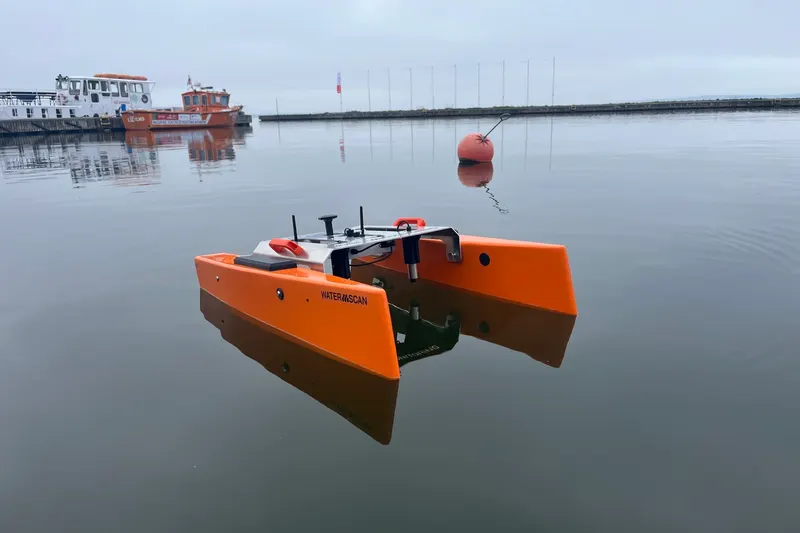
A USV surface drone works on the move and shows the spatial distribution: where the water is warmer, where oxygen is missing, where turbidity rises. One mission gives a map of the whole water body, and the sonar documents depths at the quay along the way.
We combine both approaches: the buoy keeps watch, the drone explains. A mission is planned after the buoy detects an anomaly, and the results land on the same map.
Oxygen content, pH and redox potential are early indicators of pollution or excessive eutrophication. Data analysis is automatic and you are notified of every deviation from the norm. That lets you react before the water condition gets worse.
A full description of the devices, including underwater ROV drones and cameras with AI image analysis, is on mobilemonitoring.pl (product pages in Polish).
Water level and rainfall
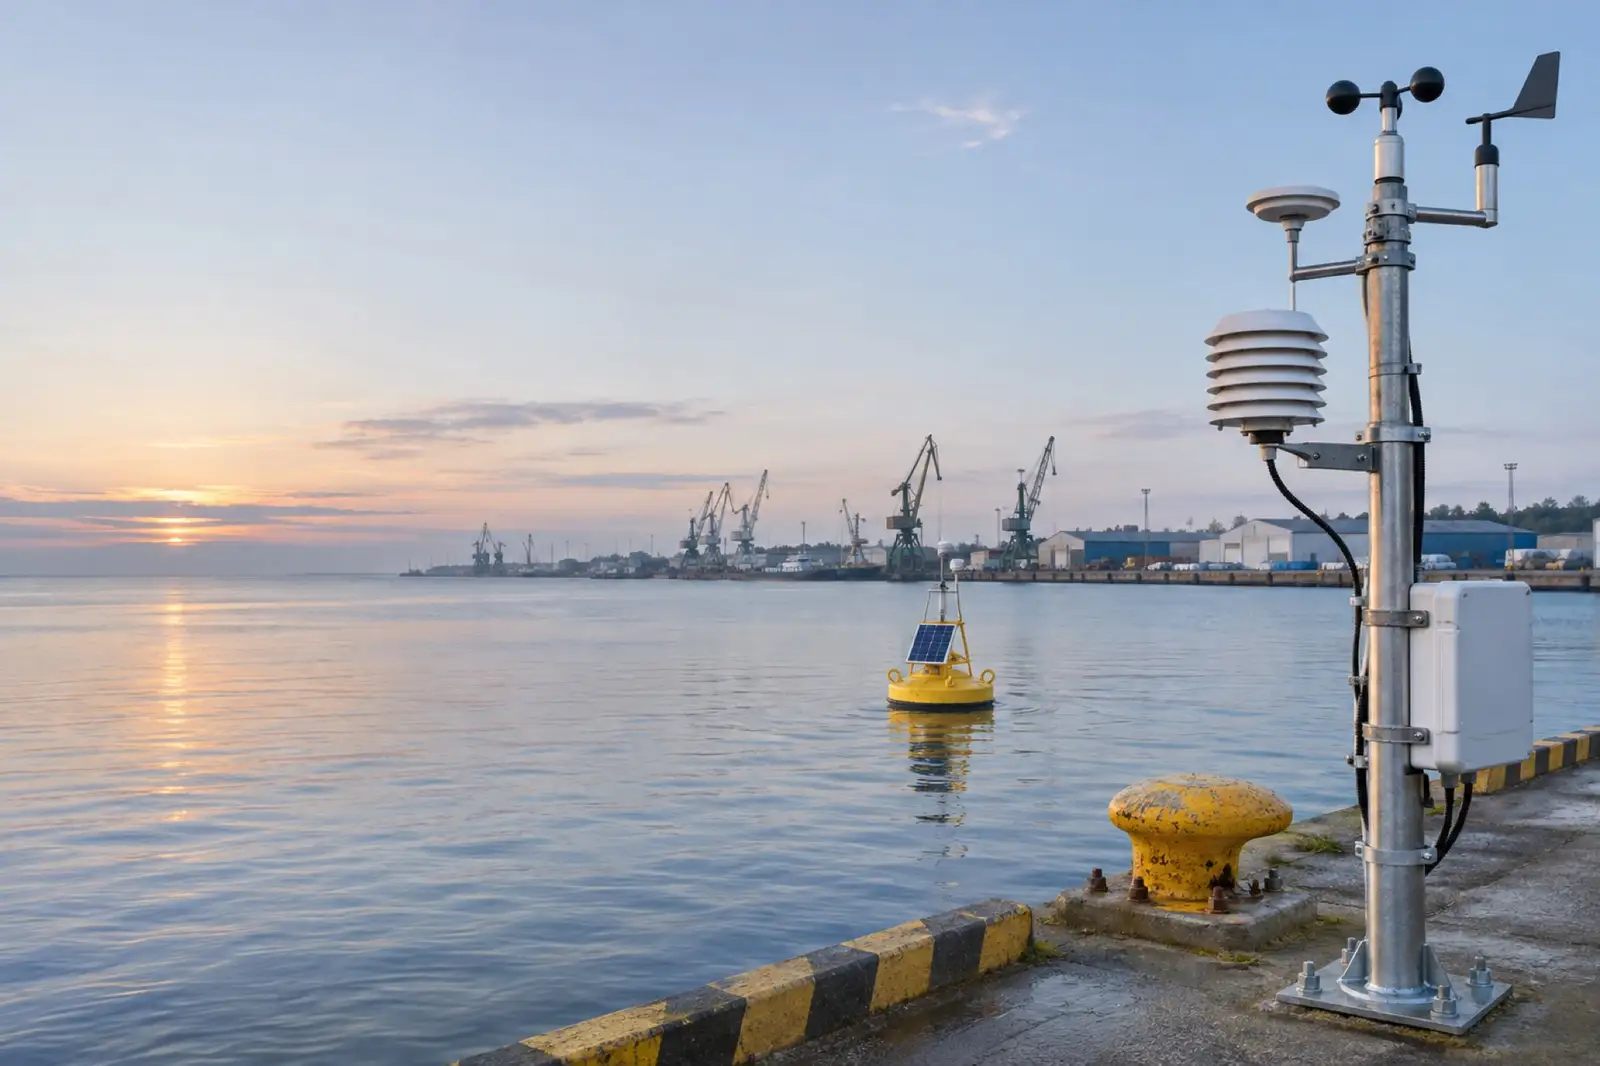
We mount level sensors on bridges, quays and in manholes. Readings every few minutes, LTE transmission, battery or solar power. The system compares the level with warning and alarm thresholds, notifies and records the course of a flood wave. Rain gauges complete the picture: you know how much fell on your site, not at a weather station on the other side of town.
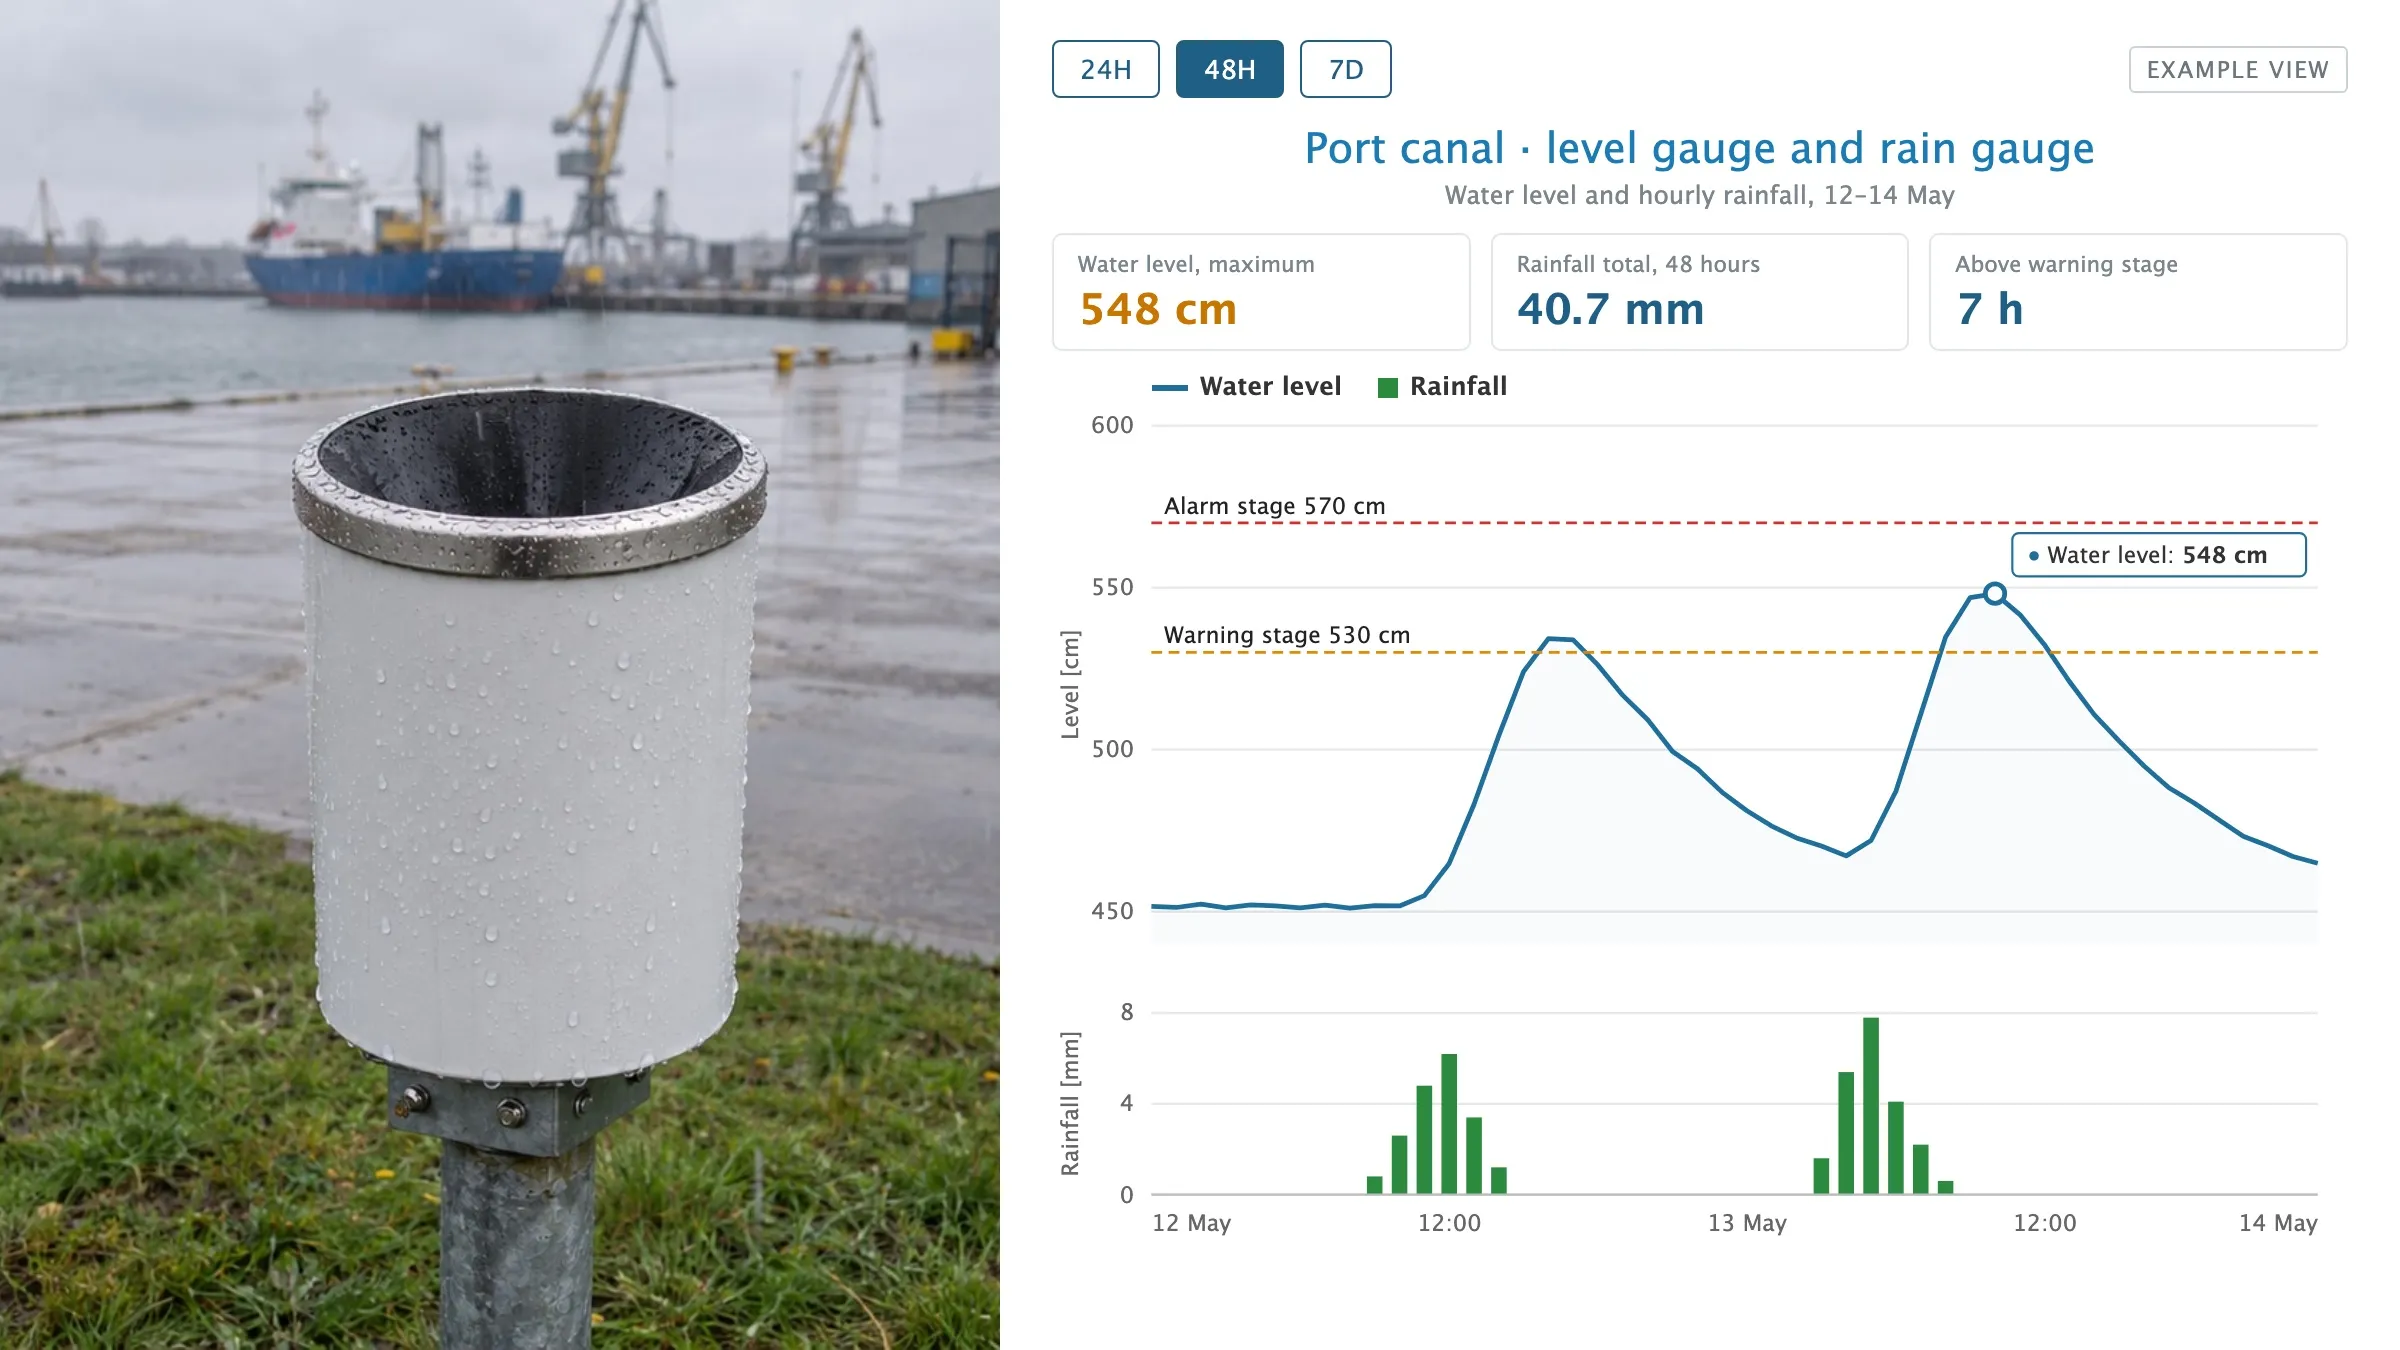
Rain gauge on the quay and an example view in CORAL: after rainfall the water level rises and passes the warning stage.
For companies that pay stormwater or retention fees we prepare reports with actual rainfall and sealed surface area.
How we start
One buoy or one drone mission is enough to see what is happening in the water. Then we agree which points need continuous monitoring and which are fine with a drone visit once a month.
Smart monitoring buoys
Continuous monitoring of water parameters, depending on needs – dissolved oxygen, redox potential, pH, conductivity, turbidity, temperature, chlorophyll-a. The buoys also detect oil leaks. Solar powered, LTE link.
Surface drone on a mission
An autonomous surface vehicle follows a planned route and monitors the water on the move. The result is a map of parameter distribution, temperature and oxygen isolines, a bathymetric profile of the bottom.
Discharge and source detection
A sudden jump in conductivity or turbidity at one point is the trace of a discharge. Monitoring on a grid of points makes it possible to estimate where the pollution comes from.
Water level and alarm stages
Radar and hydrostatic sensors on rivers, canals and reservoirs. Warning and alarm thresholds, notifications, history for flood analysis.
Rainfall record
Rain gauges on the plant site, an automatic rainfall record and reports for stormwater fees and drainage design. Numbers instead of estimates.
Data in one platform
Map, charts, point comparison, export, API. Water monitoring next to air monitoring and vessel traffic, if you use the other modules.