CORAL · Copernicus · Sentinel
Satellite data
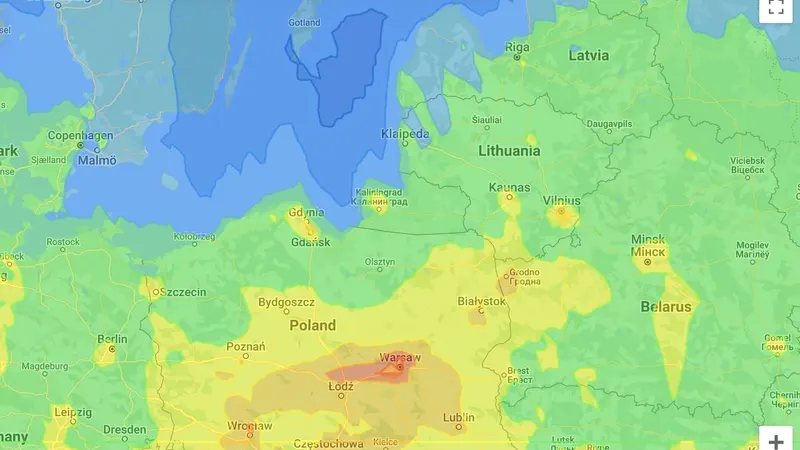
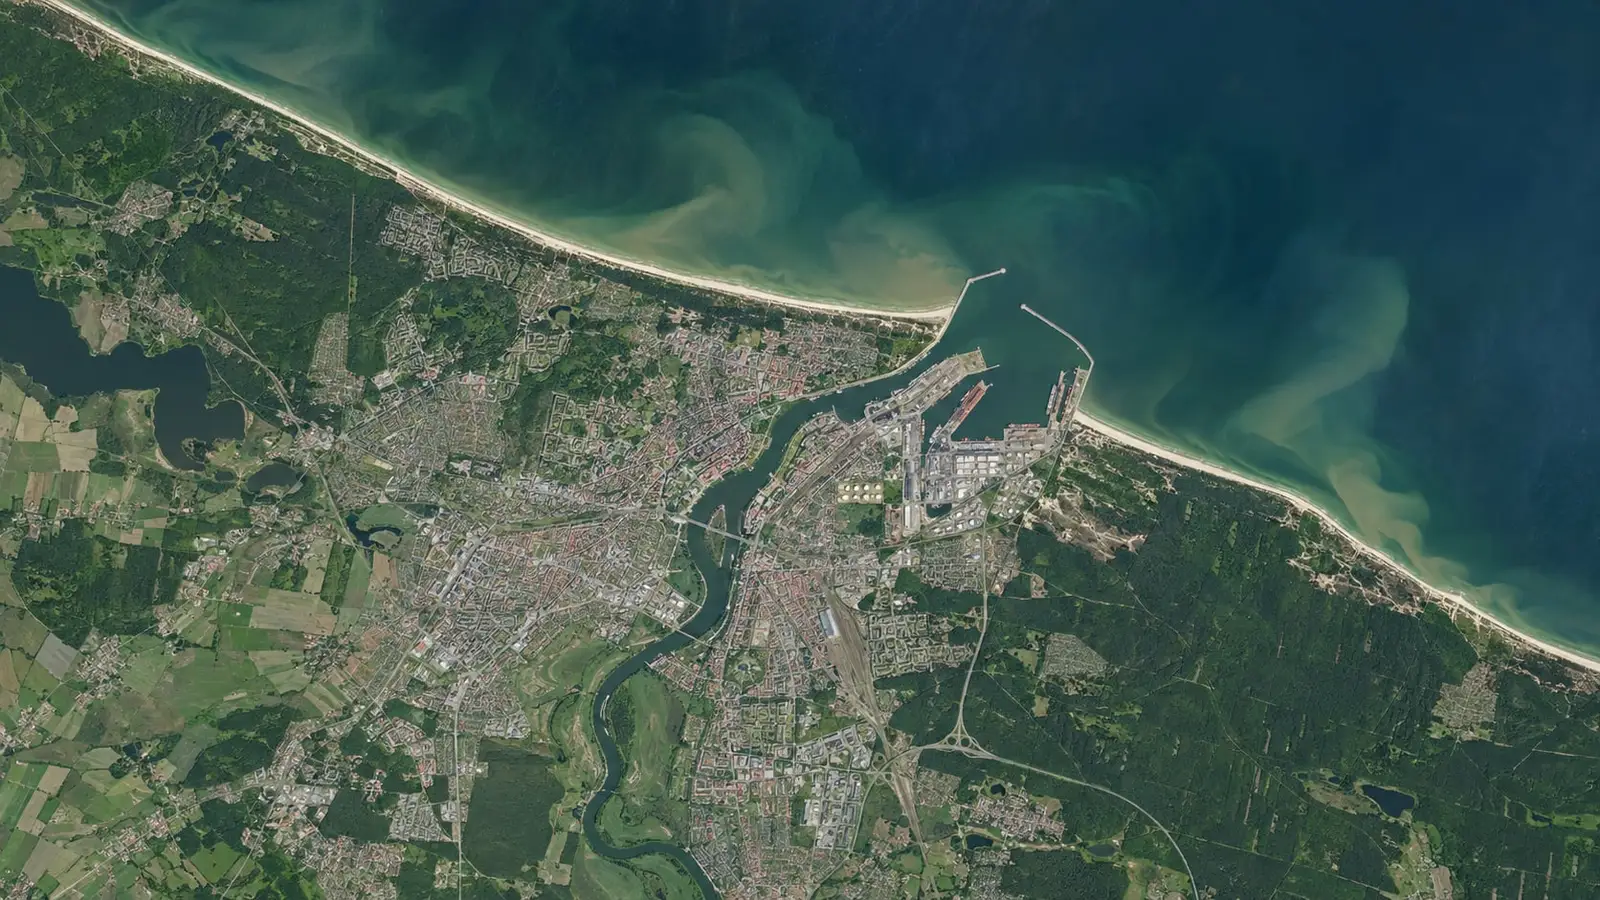
A satellite lets us see the whole water body and its surroundings, not just a single point or a small area. From Sentinel data and Copernicus products we extract what matters to a port, a coastal manager or a water authority: where and when a bloom appears, how temperature and suspended matter change, what happens to the shoreline, what condition trees and other vegetation on land are in, and what the air pollution background looks like.
What a satellite sees
The Sentinel satellites of the Copernicus programme image the Baltic and its coast every few days, and the Copernicus services (marine, atmosphere and land) deliver ready indicators: chlorophyll concentration, suspended matter, sea surface temperature, the state of the atmosphere. The data is free but raw: it has to be downloaded, cloud-filtered, calibrated and turned into indicators that mean something for a specific place.
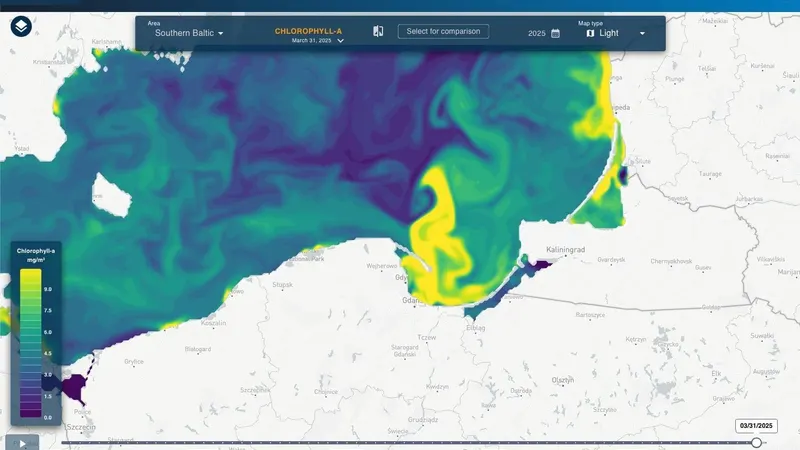
That is what we do. Tens of gigabytes of imagery become a map of one water body with a timeline, showing when a bloom started, how a plume of suspended matter moved after a storm or how the shoreline changed over five years.
How it works
- We agree the area and the indicators. A port, a bay, a lagoon, a stretch of coast; chlorophyll, suspended matter, temperature, shoreline, air pollution background.
- We fetch and process the data. Automatic download of new Sentinel imagery and Copernicus products, cloud masking, conversion to indicators, quality control.
- Results go to the CORAL platform. A map with a timeline, two dates side by side, charts for selected points, alerts when a threshold is crossed.
- Report or API. A one-off analysis ends with a report including the method. In the continuous model the data is available in the platform and through an API, for your own systems.
Period comparison and difference maps
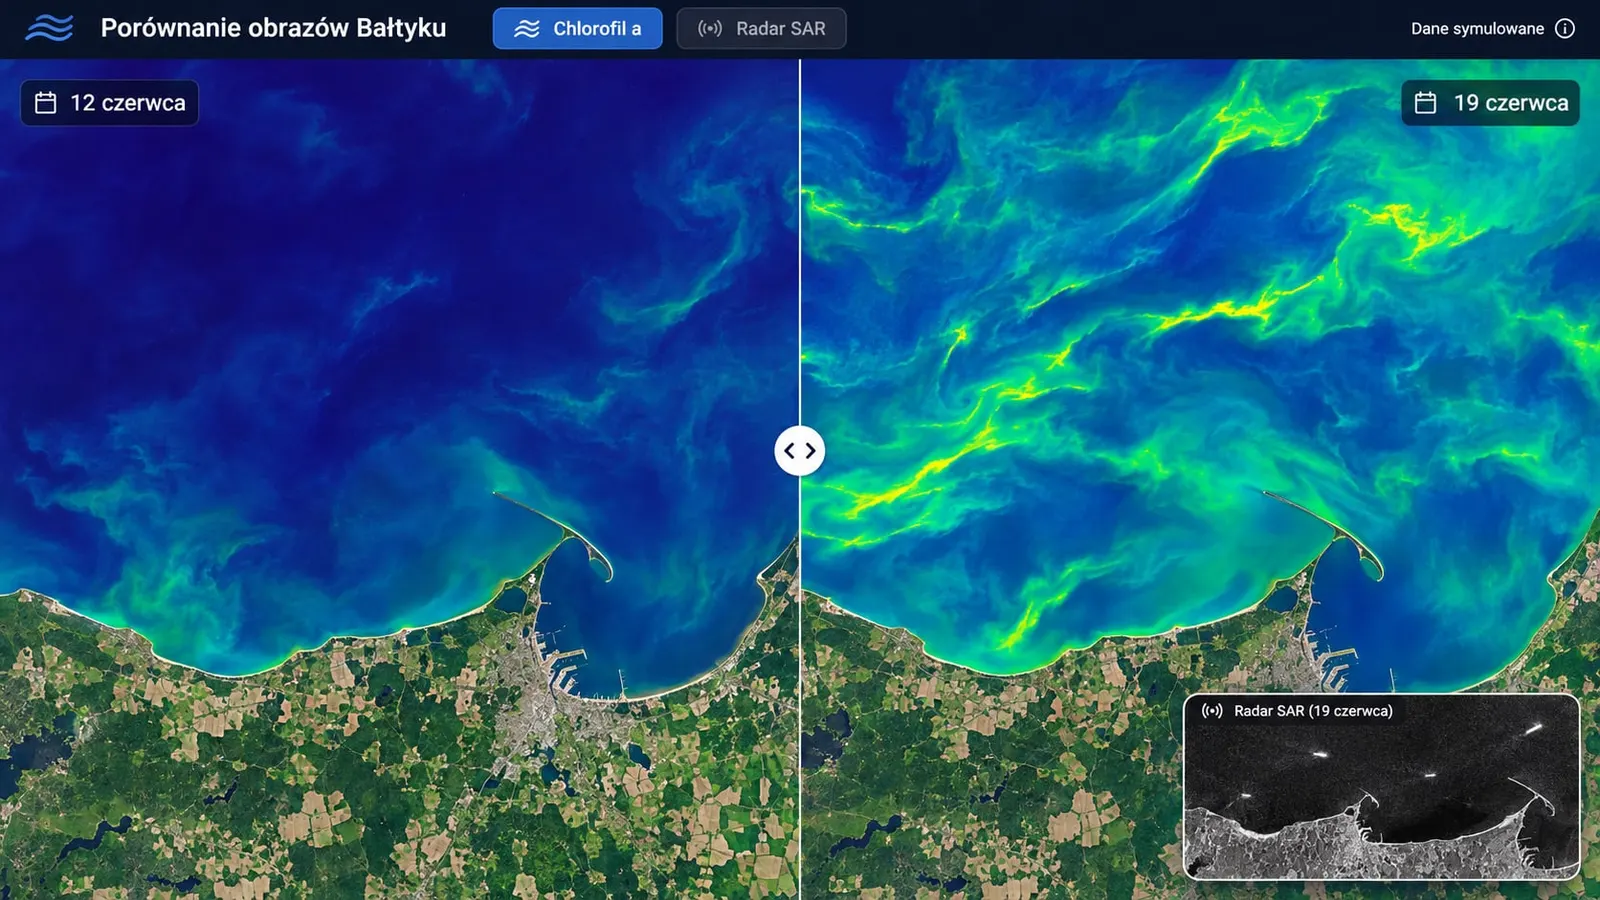
A single image tells you how things are. Only a comparison with another date tells you what has changed. In the CORAL platform you pick two dates and view them side by side on one screen, with the same scale and the same map extent. For longer analyses we compute difference maps: two images, or two averaged periods, become one map where the colour shows the direction and size of change at every point of the water body.
Typical uses: the state before and after a storm, a water body before and after dredging or an investment, the same month in successive years to see whether blooms arrive earlier and reach further, and shoreline change over several years. Every comparison comes with statistics for the selected area (mean, maximum, share of the area above a threshold) and a data export to GIS.
Satellite and sensor together
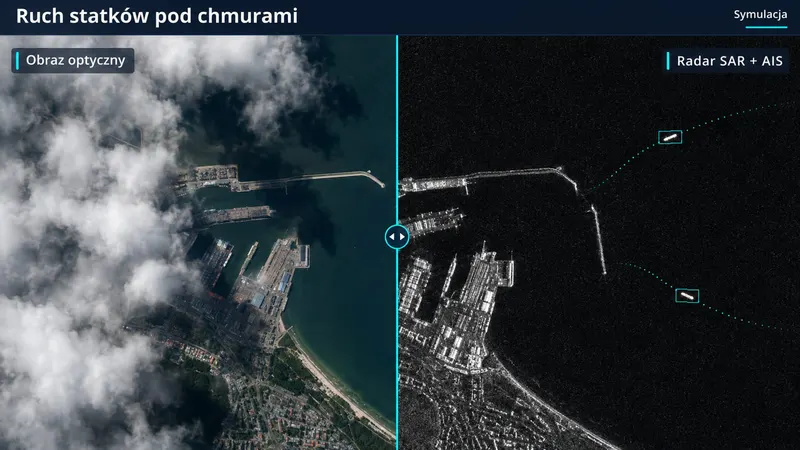
The satellite gives the whole picture, the sensor gives accuracy at a point. In CORAL both sources sit on one map: the buoy shows temperature and oxygen at depth, the image shows whether a bloom is approaching the bathing site; the station measures dust on the quay, the CAMS forecast says how much of it is regional inflow. That makes it easier to tell a local problem from a phenomenon at the scale of the whole water body.
The whole water body on one map
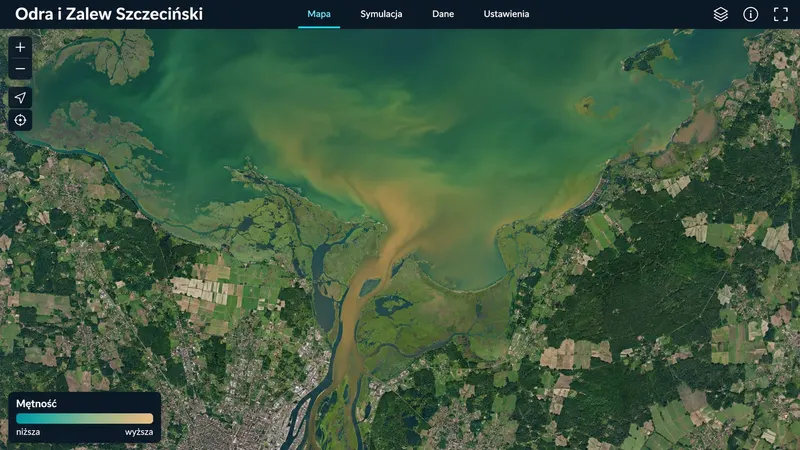
Satellite data covers an area no sensor network can: a bay, a lagoon, a stretch of coast, the whole Baltic. Day-by-day maps, a timeline and side-by-side comparison of two dates in the CORAL platform, next to data from stations and buoys.
Water quality from orbit
Chlorophyll-a and cyanobacterial blooms, suspended matter, turbidity, sea surface temperature. Early warning for bathing sites, ports and water intakes.
Shoreline and land change
Comparing imagery from successive years shows coastal erosion, beach growth and changes on port and development land.
Period comparison and difference maps
Two images side by side or a single difference map: where and by how much chlorophyll, suspended matter, water temperature or the shoreline changed between chosen dates, seasons or years.
Air pollution background
Copernicus CAMS forecasts and analyses: particulate matter, ozone, nitrogen dioxide at regional scale. They help separate emissions driven by regional conditions from those caused by local activity.
On request or automatically
A one-off analysis with a report, or a CORAL module that fetches new imagery itself, processes it and shows it on the map.
What it looks like in the platform