CORAL · Mobile Monitoring
Smart Port
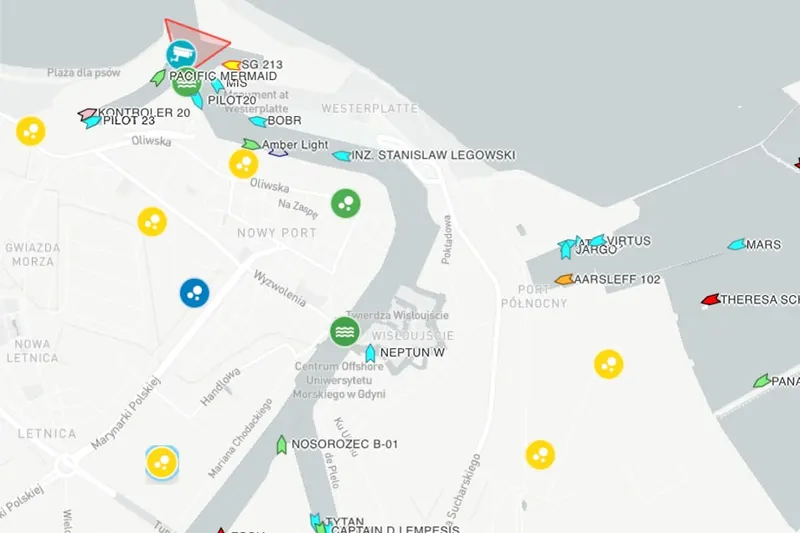
The CORAL platform shows the port on one map: which vessels are in port and since when, which berths are occupied, where the parcel boundaries and infrastructure are, what the drone sees. For ports that want to manage on data without the budget of a large container terminal.
Simple tools for port digitalisation
Large container terminals need operating systems worth millions. Smaller ports have different needs. The CORAL platform was built for the second group: it starts with one module, runs in a browser and a mobile app, and further functions are added when they are needed.
Modules
Vessel traffic. We install our own independent AIS receiving stations in the port, so traffic data does not come from an external provider: the port has its own reception, with no subscription to an intermediary. Where AIS is not enough, we add cameras. Camera stations are installed together with Mobile Monitoring, and you can see what such a station looks like on the Marine Guard page (in Polish). The platform records arrivals and departures, shows current positions, counts time at berth and builds monthly statistics. The data is available to the harbour master, operators and the billing department.
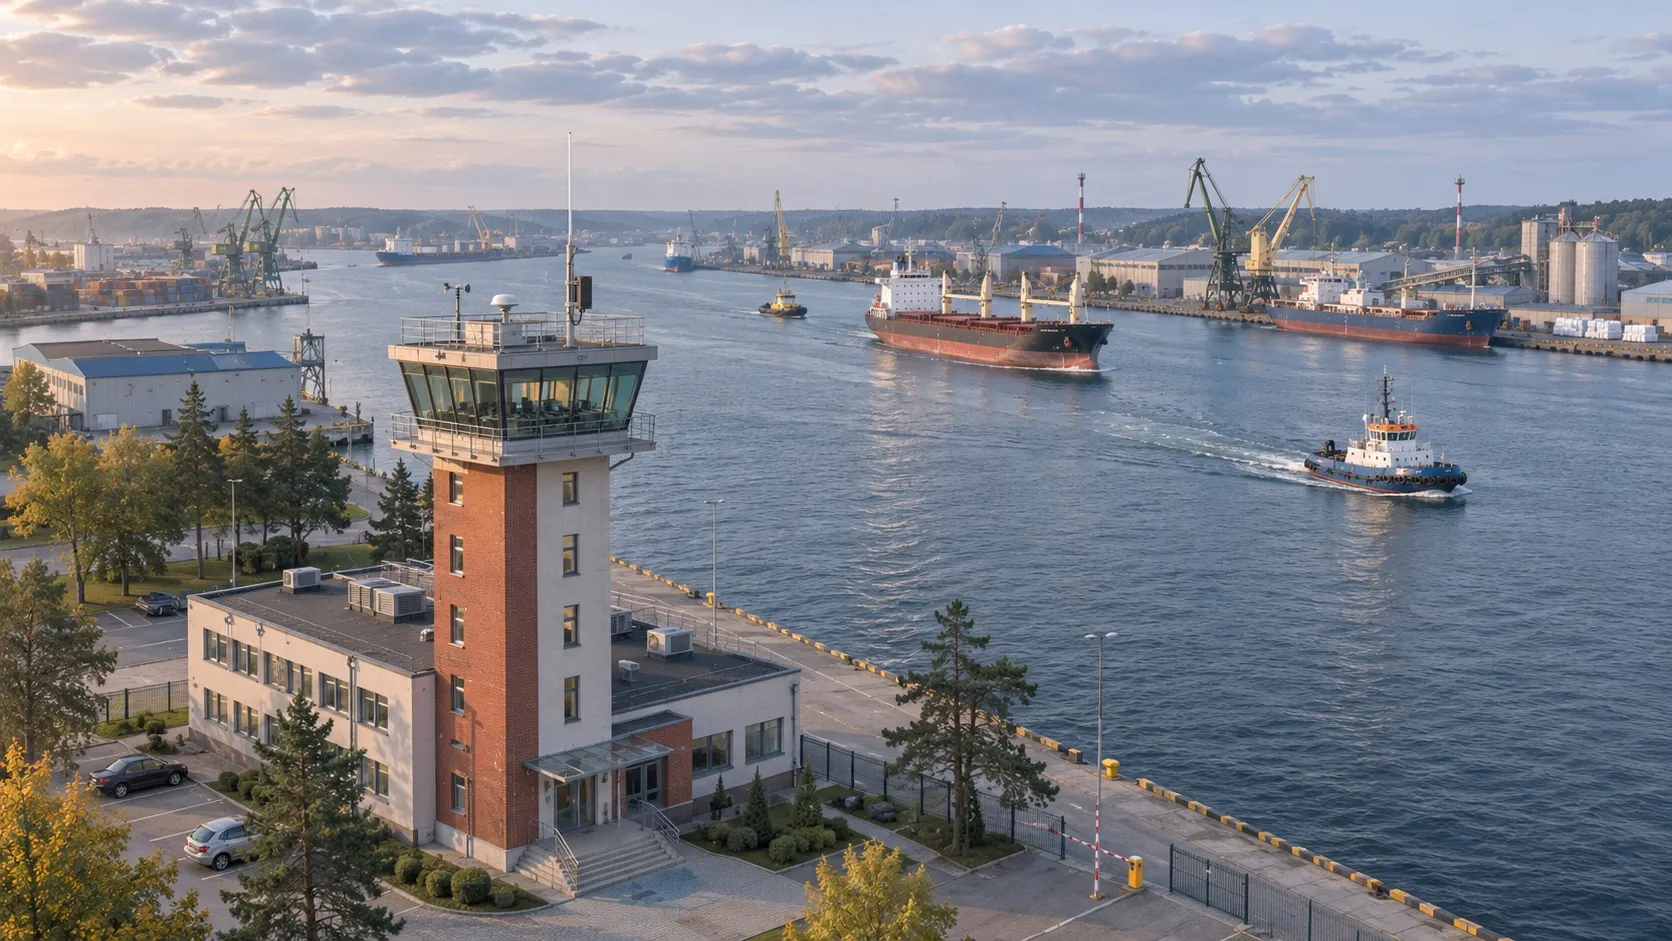
Our own AIS receiving station on the harbour master’s roof: the port itself receives the signal from vessels in the channel and at the quays.
Berths. A live berth occupancy map, a booking calendar with confirmations, an infrastructure utilisation report. The operator books from a phone, the harbour master approves.
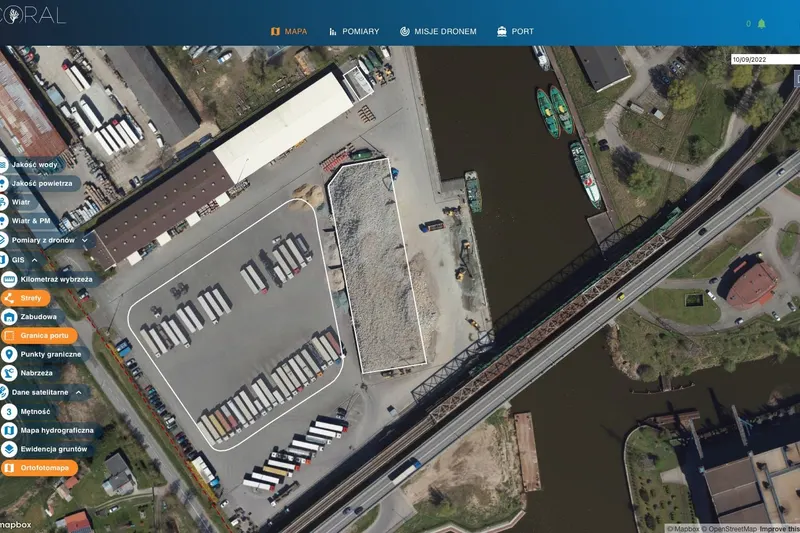
Property and infrastructure. GIS layers with parcel boundaries and numbers, buildings, networks, quay equipment and documentation. Cadastral data combined with your own surveys and flights.
Drones. Photogrammetric flights over the terminal produce an orthophoto map and a terrain model. Detection algorithms count objects in the yards and flag changes between flights. Satellite data complete the picture at the scale of the whole water body.
Environment. If the port uses air or water monitoring or dust risk forecasts, everything is in the same view. The vessel at the quay, the reading from the station next to it and tomorrow’s wind forecast, all in one platform, presented in a clear and accessible way.
Who it makes sense for
A port that wants to answer: how many vessels stayed how long last quarter, which berth is overloaded, where exactly the port boundary runs and what changed in the yard since the last flight. If those answers are currently spread over notebooks and binders, CORAL brings them into one place.
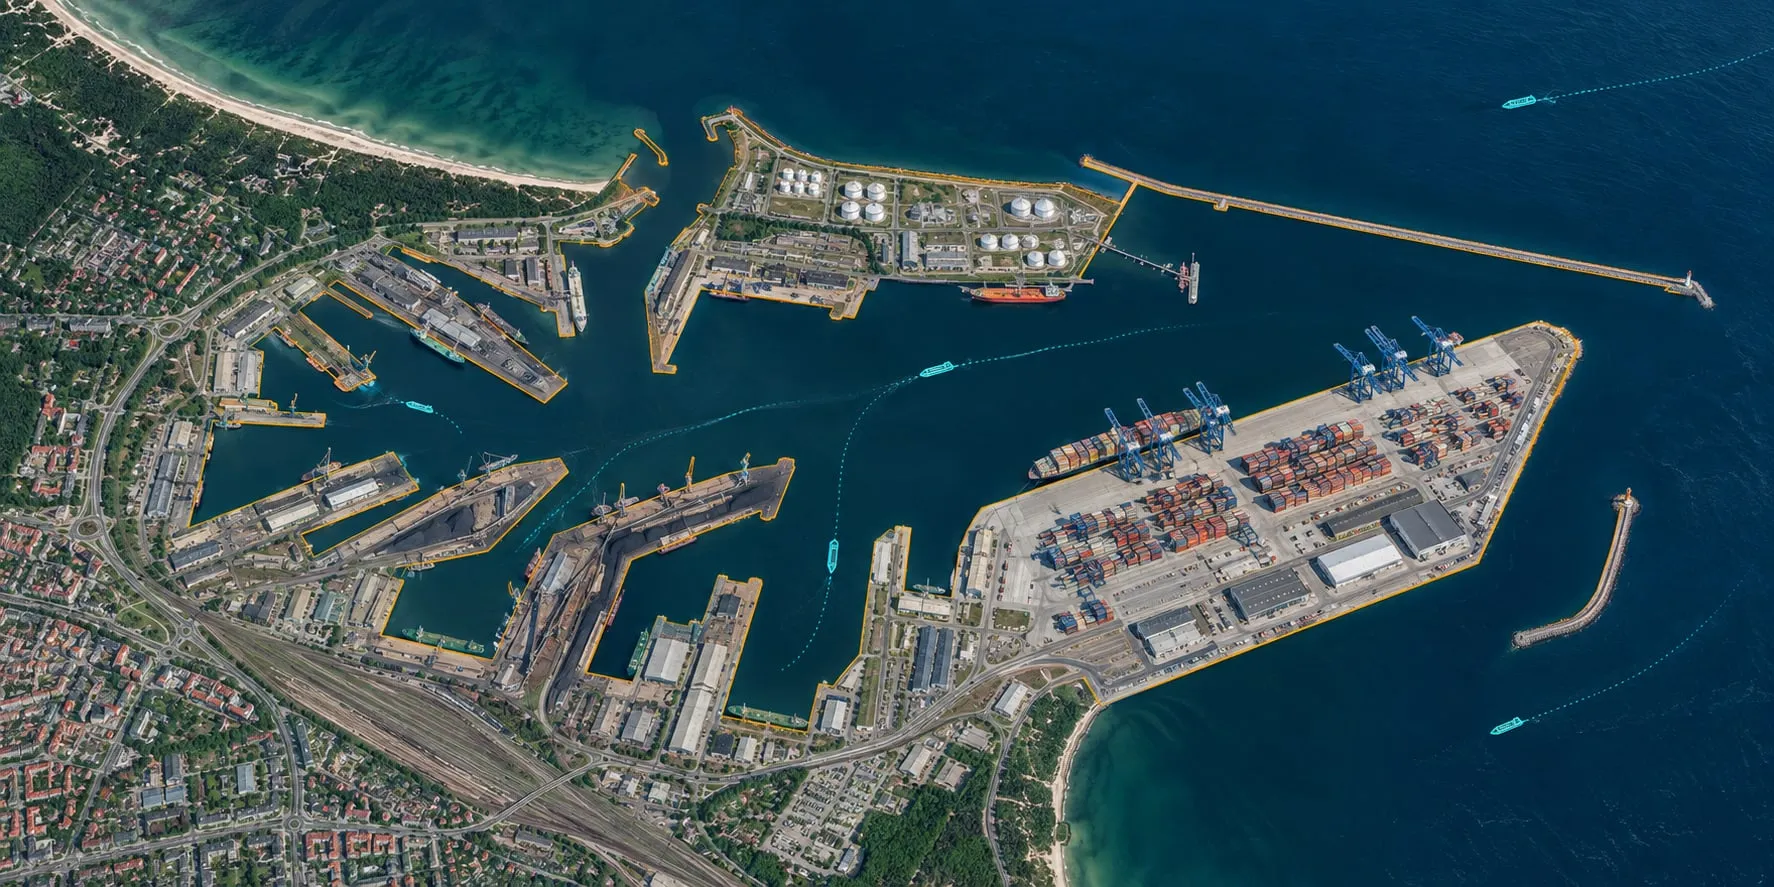
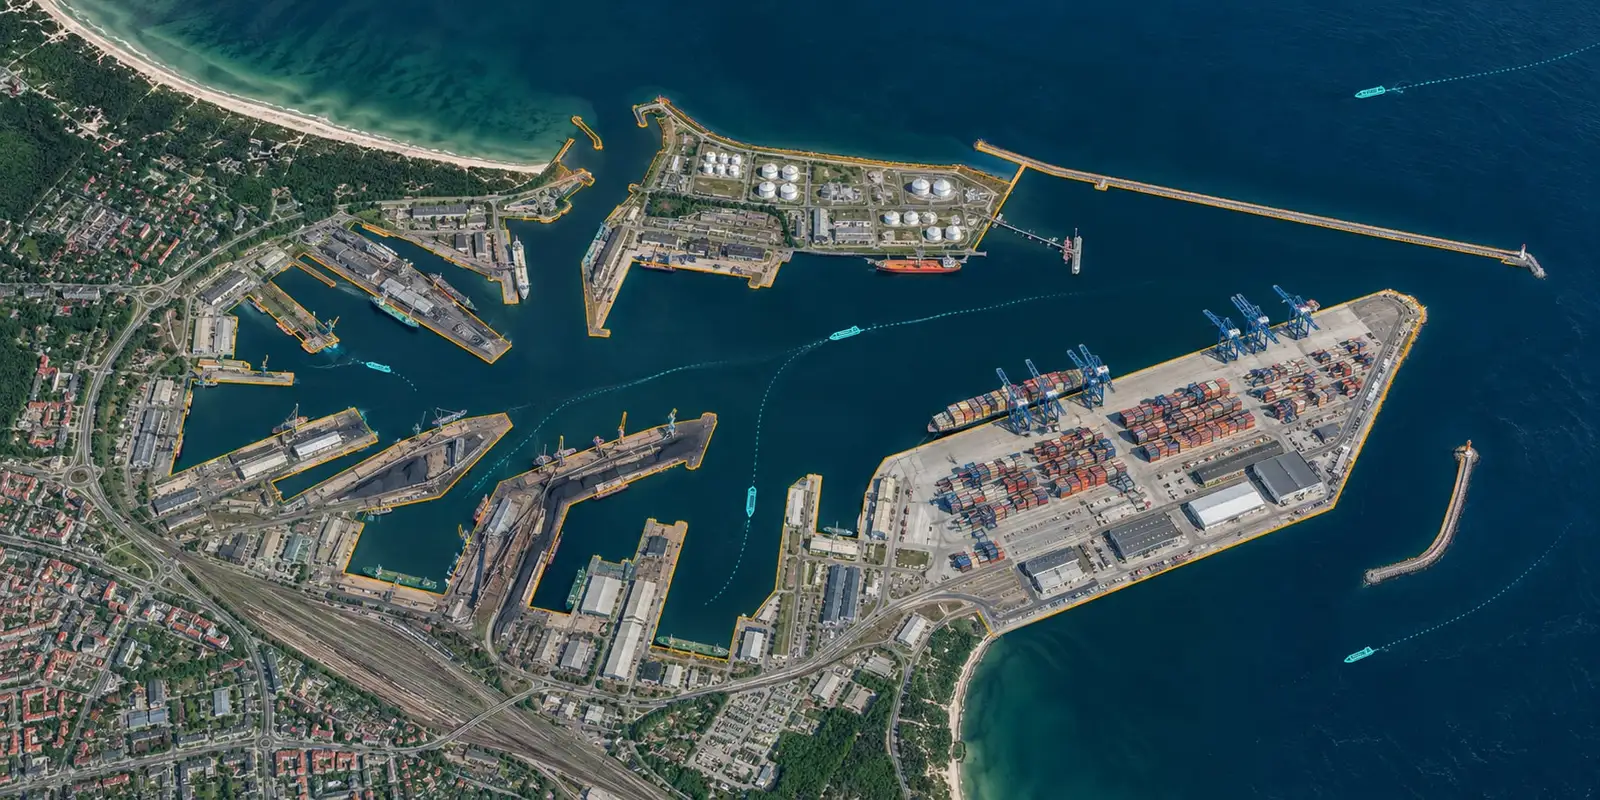
The port on one map: quay outlines, vessel positions and tracks over an aerial image.
Vessel traffic 24/7
Our own independent AIS receiving stations and cameras show arrivals, departures and vessel positions. No external data provider. Stay history, cargo statistics, time in port for every vessel.
Berths and bookings
Live berth occupancy, a booking calendar for operators, utilisation reports. No more whiteboard and phone calls.
Property in GIS
Parcel boundaries, buildings, networks and equipment on one map with documents. An inventory you can keep up to date instead of rebuilding every few years.
Drone orthophoto maps
A survey flight over the terminal, a high-resolution orthophoto map and automatic object detection: containers, vehicles, stockpiles, pavement damage.
Environmental data in the same view
Air, water, dust risk and vessel traffic on one map. You can see which vessel was at the quay when dust concentrations rose.
What it looks like in the platform