Air quality and dust monitoring
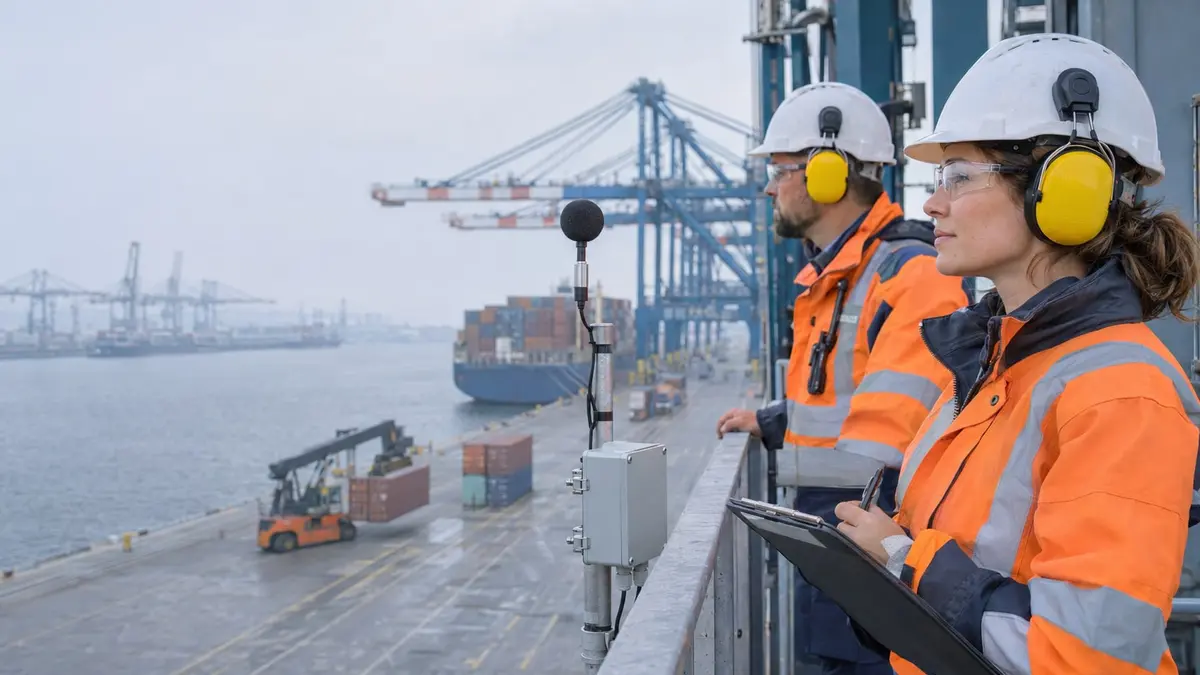
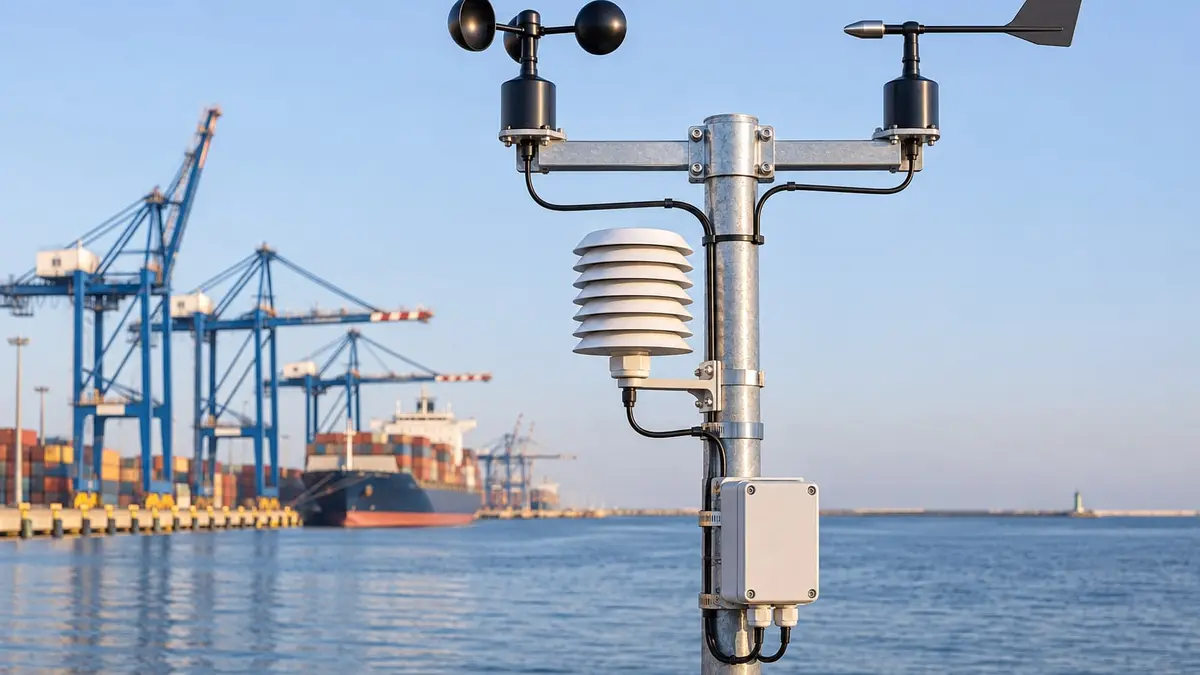
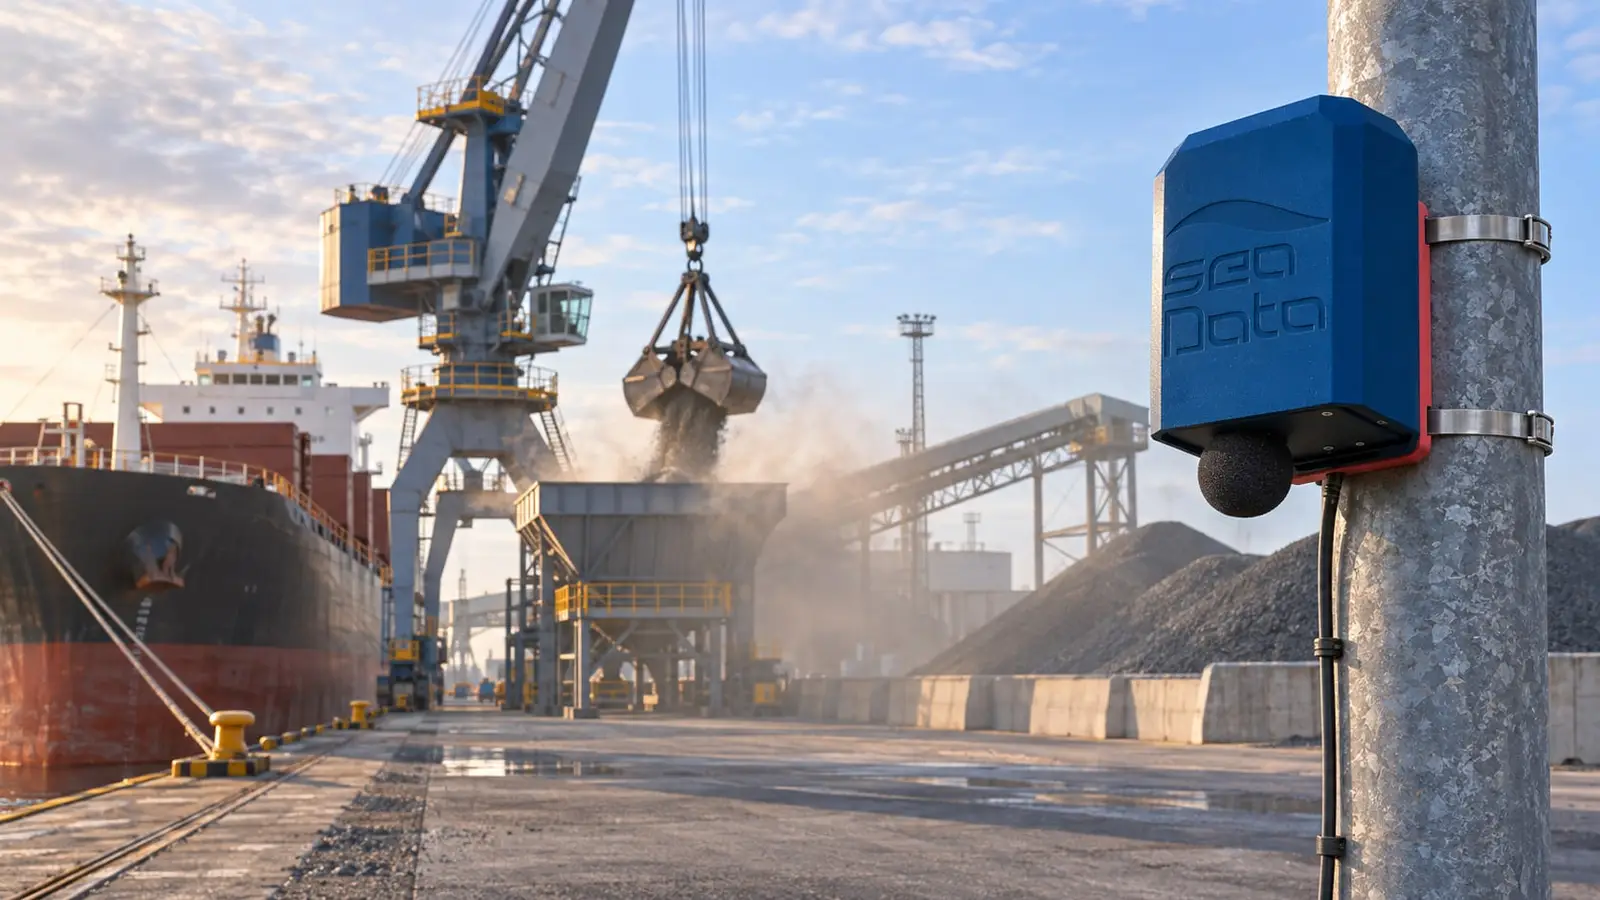
YetiBox stations monitor dust, noise and weather 24/7. Map, alerts and reports in the CORAL platform.
Details: Air quality and dust monitoring
Different needs, different data sources, one platform that connects them. Each area can be deployed on its own and extended when the time comes.
YetiBox stations monitor dust, noise and weather 24/7. Map, alerts and reports in the CORAL platform.
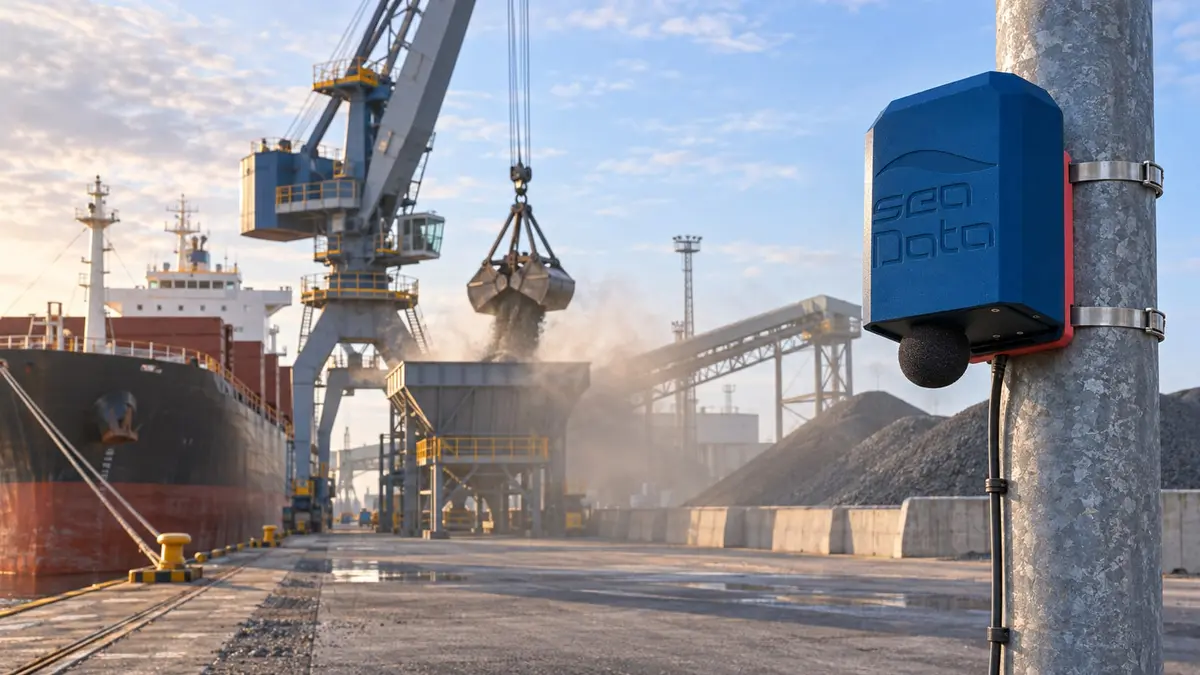
Details: Air quality and dust monitoring24/7 noise monitoring in YetiBox stations. Accredited measurements and acoustic maps with Hydroacustic. Noise when nobody is working can signal a threat. Set alarms.
In cooperation with Hydroacustic
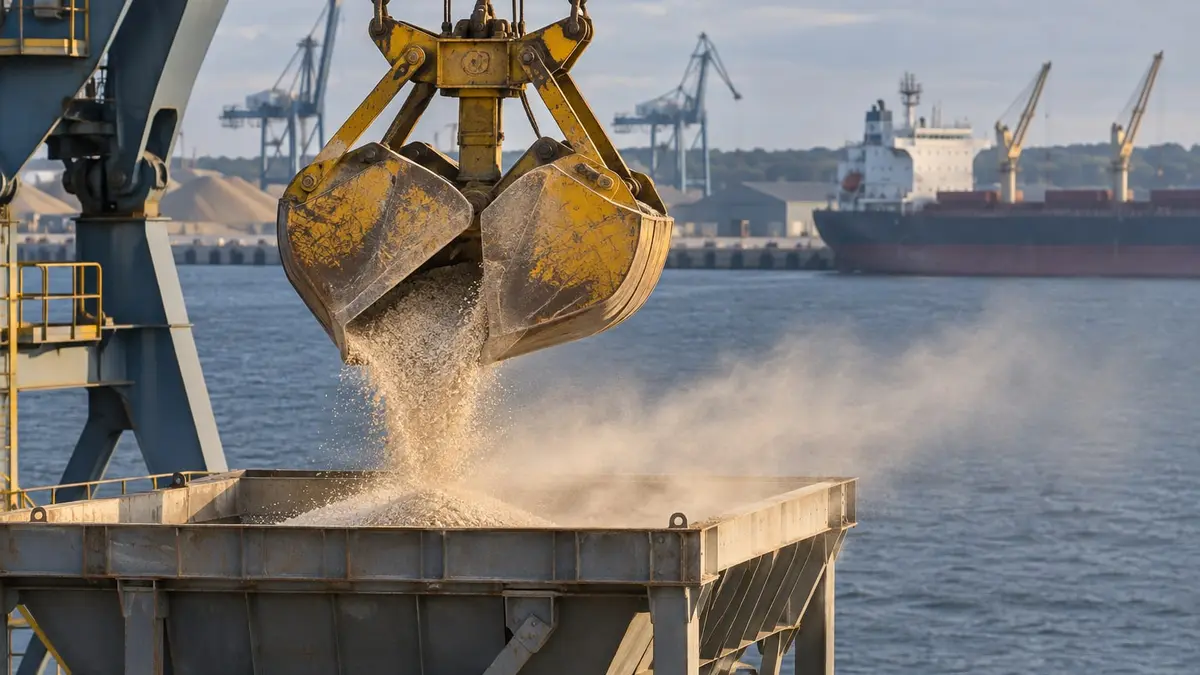
A 72-hour forecast of dust from stockpiles and cargo handling, for each terminal and cargo type.
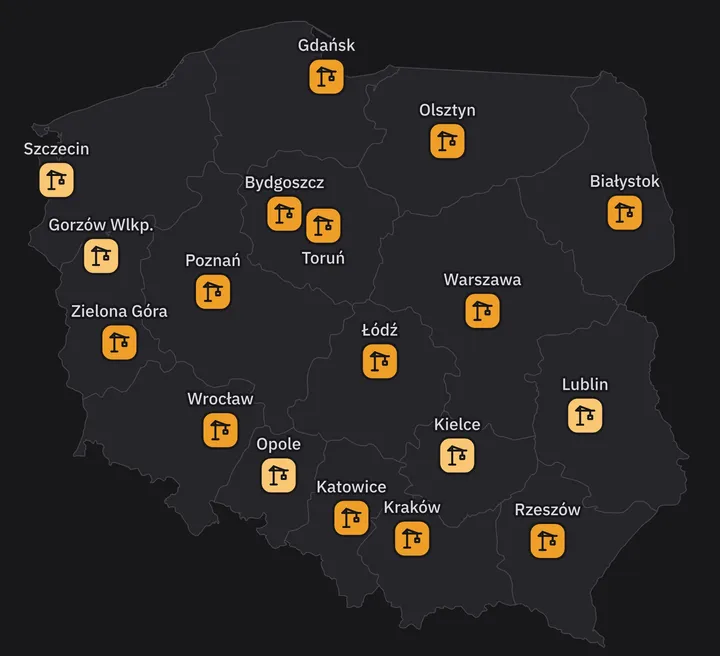
Details: Dust risk forecastA daily dust-risk map for 18 Polish regional capitals. Construction and logistics, 24 and 72 hours.
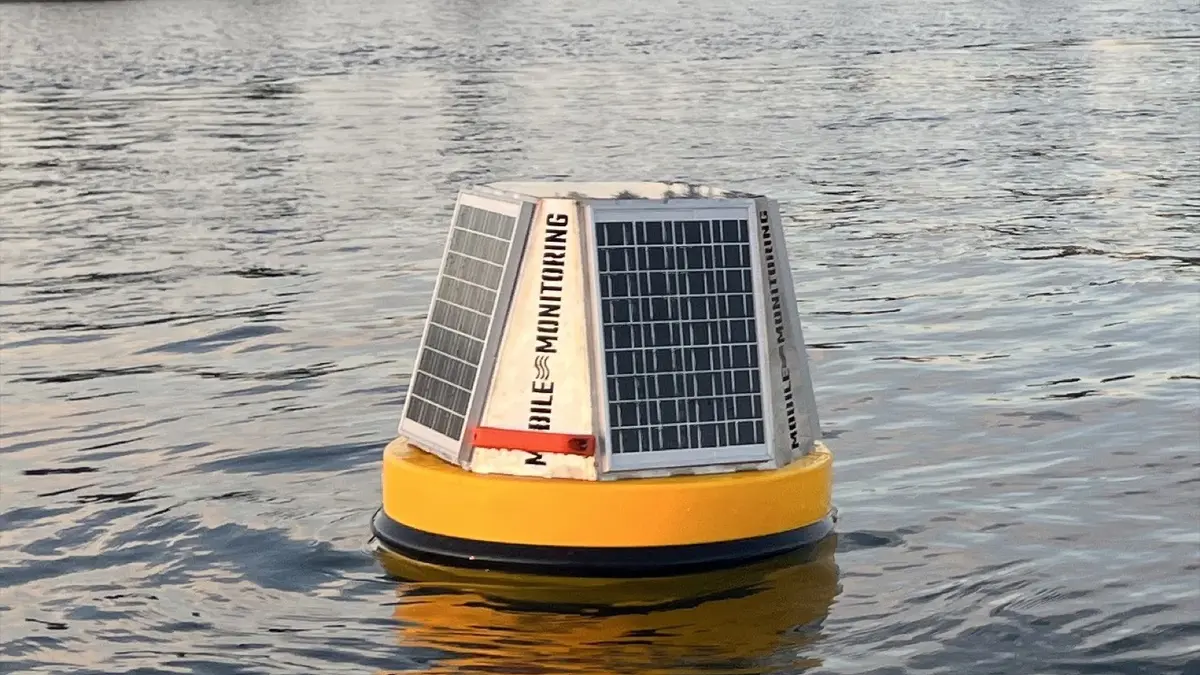
Details: Urban dust forecastWater quality with Mobile Monitoring buoys and surface drones, water level and rainfall. All monitoring, alarms and reports in the CORAL platform.
In cooperation with Mobile Monitoring
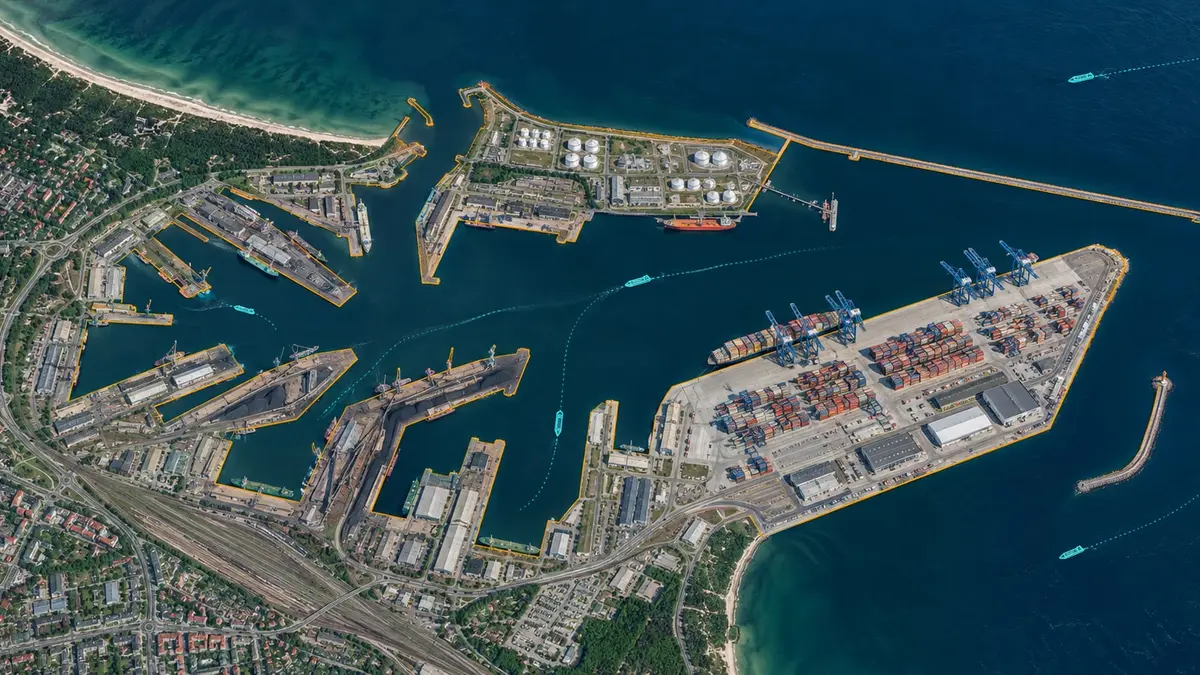
AIS vessel traffic, berths, GIS and drone orthophotos on one port map in the CORAL platform.
In cooperation withMobile Monitoring
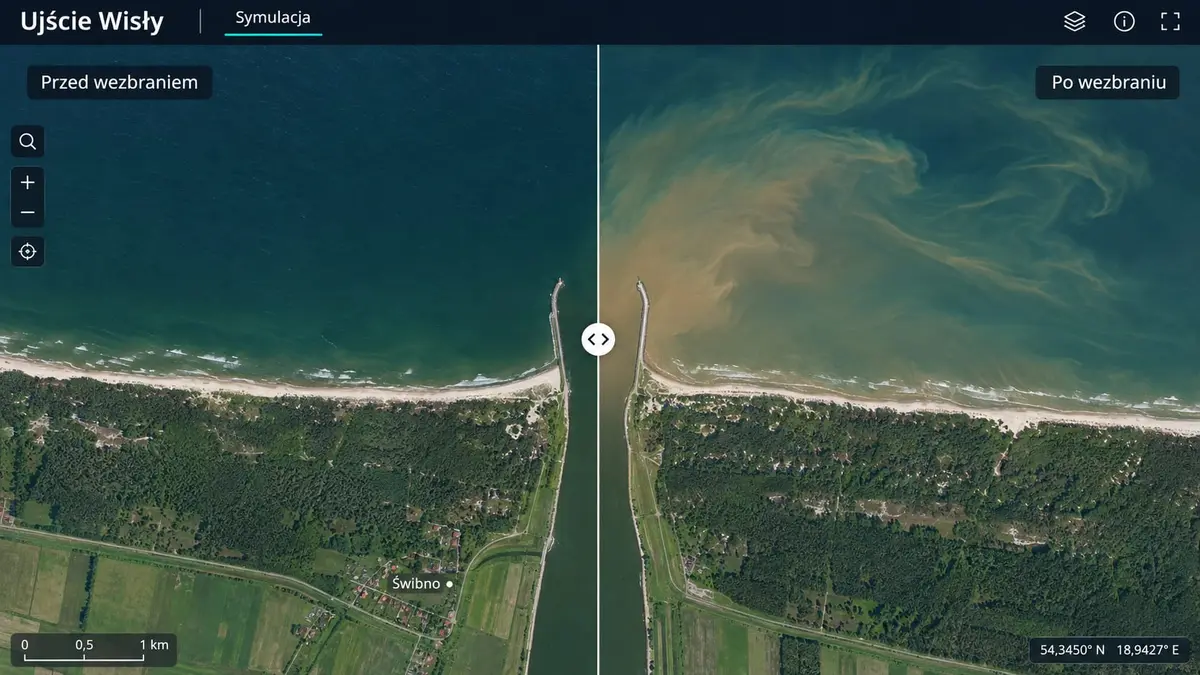
Sentinel and Copernicus in CORAL: blooms, suspended matter, water temperature, shoreline, pollution background, crop and vegetation health in a chosen area.
Details: Satellite dataCustom systems: a wide range of sensors and weather stations, integration with existing infrastructure, dashboard, API, mobile app and AI support.
Details: IoT systems and dataNew · free
Every morning we compute whether the weather in the next 24 and 72 hours favours dust being lifted from construction sites and logistics yards. For every Polish regional capital, on a scale from 1 to 4.
In business since 2017
SeaData has been operating since 2017. Since then we have delivered environmental monitoring and data analysis systems to ports, companies and local governments. We have a stable group of clients we have worked with for years, and our first deployment, the station network in the Port of Gdynia, has been running without interruption since 2018.



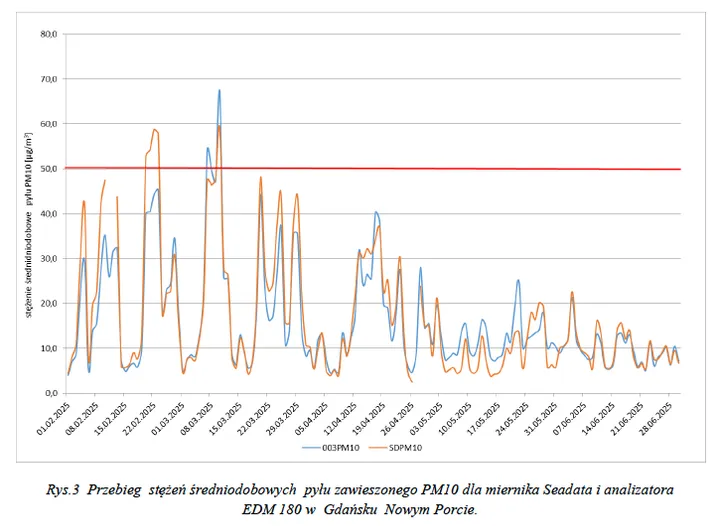
Proven in practice
Comparative measurements by
Comparative measurement report (PDF, Polish)
PM10 and PM2.5 device quality certificate (PDF, Polish)
We visit the site, agree what to monitor and where, and install the first devices. After a few weeks you have data to base the decision on a full deployment on.
We install the station network, buoys or sensors and connect existing data sources and forecasts. Everything lands in one platform with a map, charts and alerts.
We service the devices, watch data quality and deliver periodic reports and data for inspections or environmental reporting.