
CORAL · YetiBox
Air quality and dust monitoring
A network of YetiBox stations around the plant, the CORAL platform with a map, alerts and reports. You know how much dust is in the air, where it comes from and whether it crossed the limit before the inspectorate calls.
Why monitor dust in a port or plant
Handling coal, ore, fertiliser and aggregates raises dust. Residents see it and find it a nuisance, which brings environmental inspections and the need to collect data continuously. And when action is taken, the terminal operator needs reliable proof of the scale of the change. Air quality monitoring answers three questions at once: how much dust is in the air, where it comes from and whether something has to be done right now.
The YetiBox station network has been running in Poland’s largest ports (Gdynia, Gdańsk) since 2018. It monitors PM10 and PM2.5 particulate matter and noise inside and outside the port boundary, and the system compares the results with permitted levels as they come in.
How it works
- YetiBox stations go where it matters: on the quay, at the plant boundary, near the closest housing. Mains or solar power, LTE transmission.
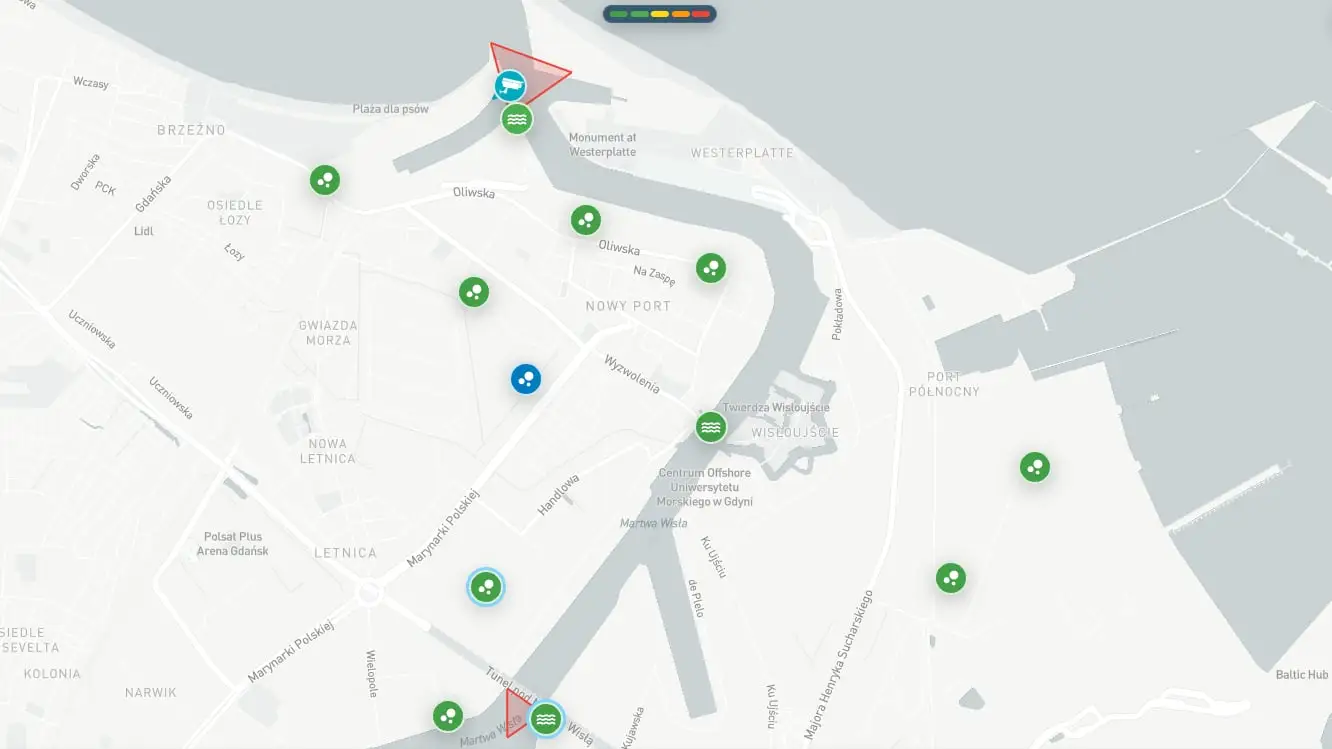
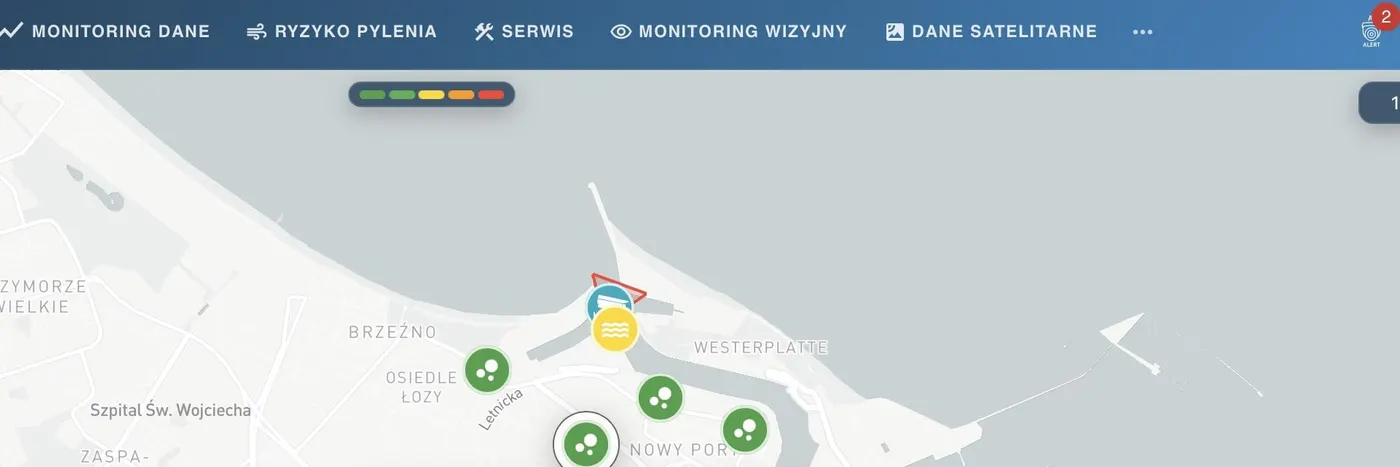
- Data lands in the CORAL platform every few minutes. Map, charts, station comparison, pollution roses, weather forecast and public data (national inspectorate, Copernicus) in one view.
- Alerts go to the people who can react: the dispatcher, the terminal manager, the environmental team. Every exceedance is recorded as an episode with its duration and source.
- Reports generate themselves daily, monthly and annually. Data can be downloaded as CSV or pulled through the API into your own systems.
Monitoring you can defend
A low-cost monitor is only as good as its comparison with a reference. In 2025 the ARMAG Foundation ran comparative measurements of our device against a GRIMM EDM180 analyser at the AM3 station in Gdańsk Nowy Port. The measurement report and the quality certificate are available for download (in Polish). We repeat the comparisons periodically, because sensors age and are affected by the weather.
What the service includes
Devices, installation, transmission, platform, service and sensor replacement. We offer it as a subscription, with no hardware investment. If you need a different arrangement, we are happy to discuss it and adapt the terms. We start with a pilot of one or two stations and decide on the target network together after a few weeks.
What it looks like in the platform
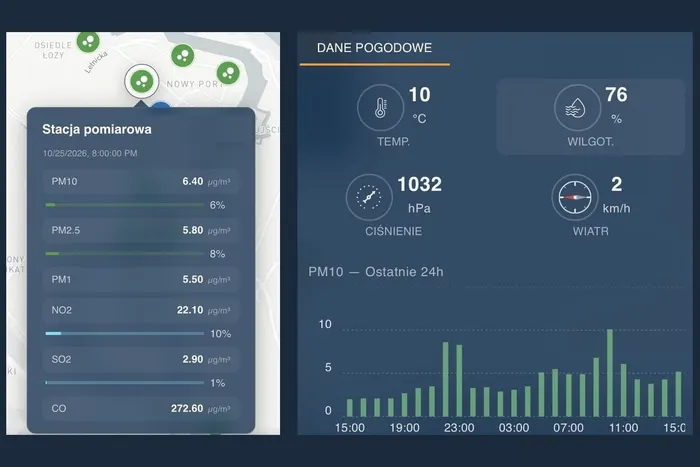
PM10 and PM2.5 every minute
Optical particulate monitors with humidity compensation, calibrated against a reference analyser. PM1, gases and odour sensors as options.
Noise and weather in the same station
Sound level around the clock, temperature, humidity, pressure, wind speed and direction. One enclosure, one power supply, one LTE link.
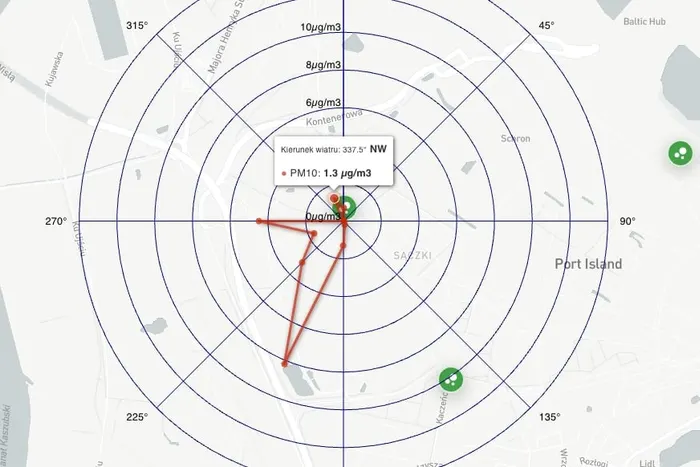
Pollution rose points to the source
We combine concentrations with wind direction and show which side the dust arrives from. It settles arguments about whose dust it is.
Alerts and exceedance episodes
Warning and alarm thresholds, SMS and e-mail notifications, an automatic log of episodes with duration and peak values.
Reports ready to send
Daily, monthly and annual reports, station comparison, CSV export, API. Data in a format the inspectorate and the ESG team understand.
Service and data quality
Remote station diagnostics, scheduled sensor replacement, periodic comparison with a reference. Monitoring you can trust for years.