Public map · GFS + IFS
Urban dust risk forecast
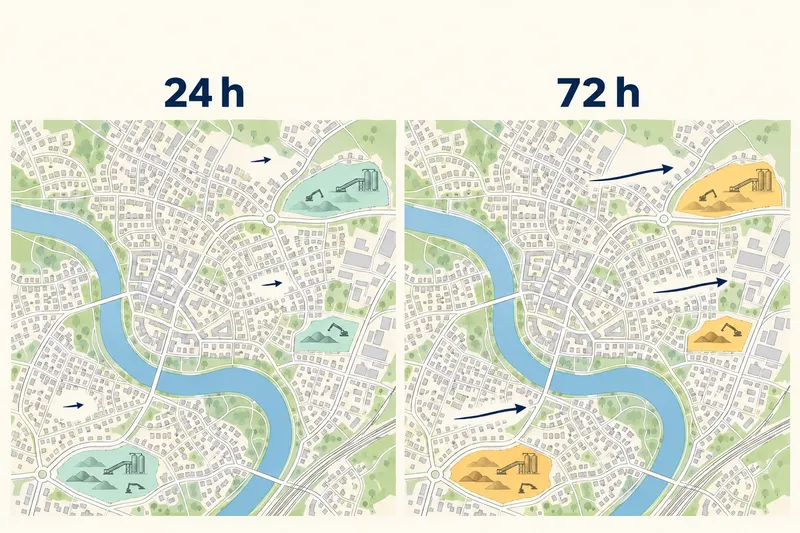
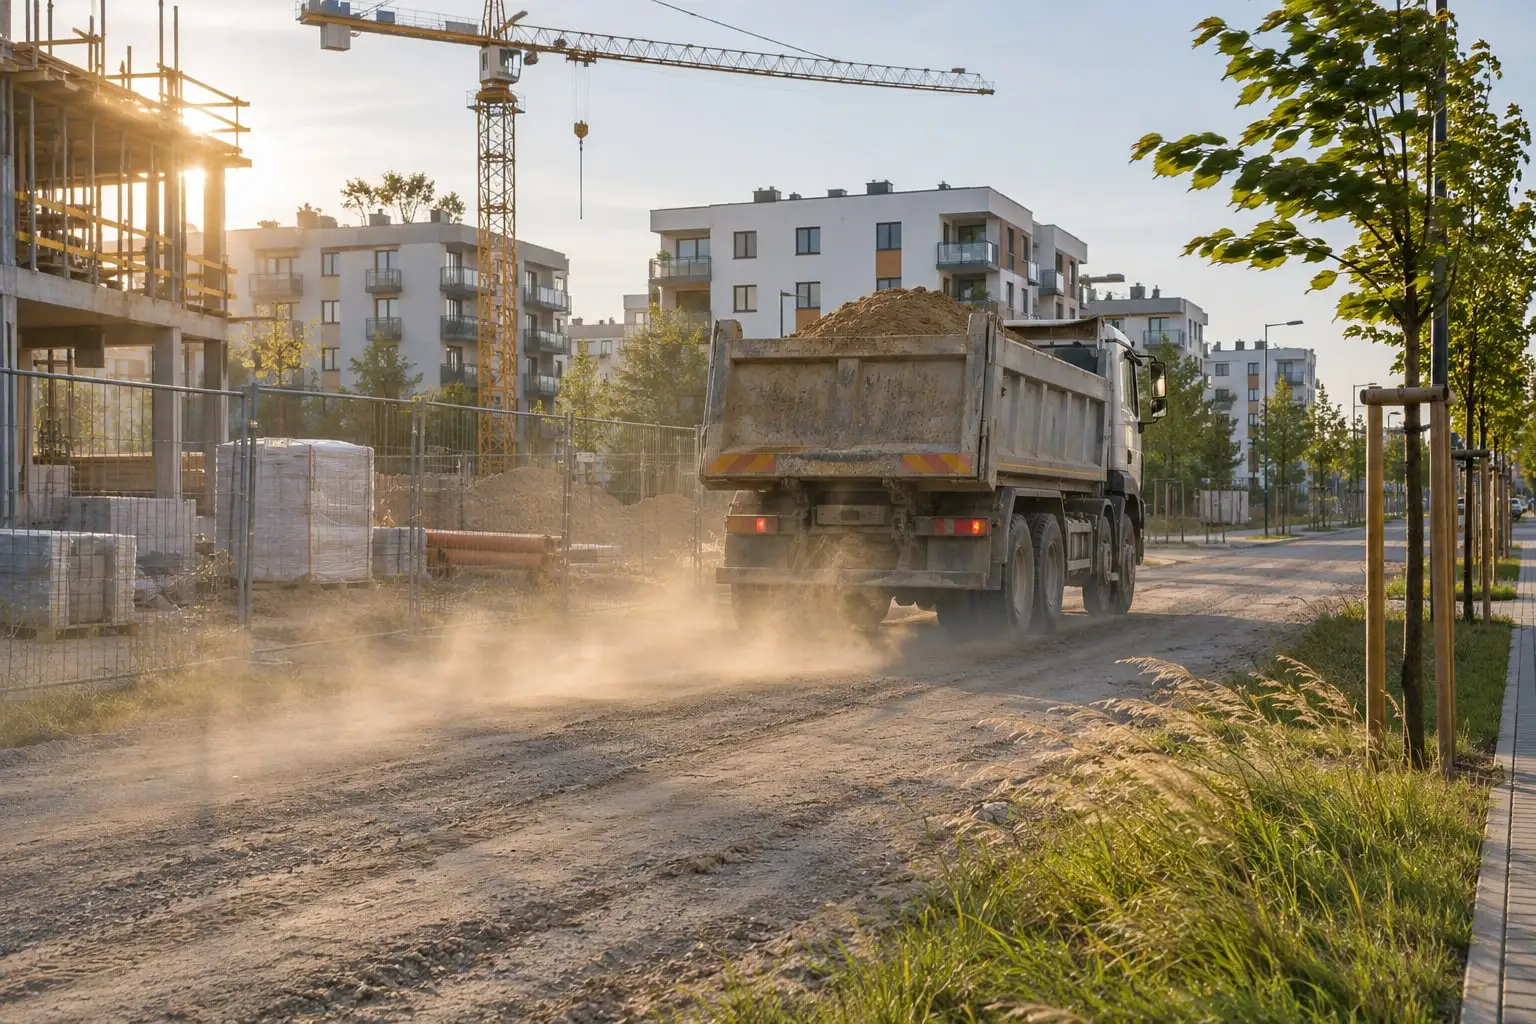
Will the weather in the next 24 or 72 hours lift dust from a construction site, an access road or a yard? The map answers that every morning for each of Poland's 18 regional capitals. Free, no login.
What the map shows
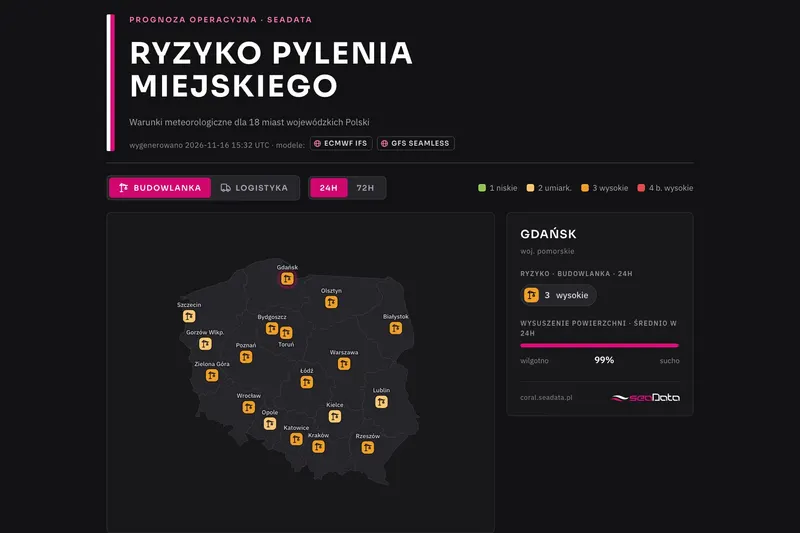
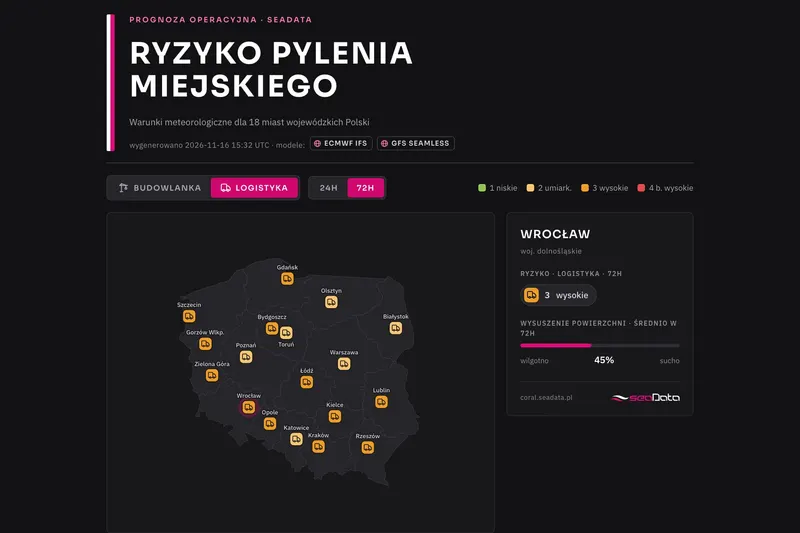
For each of the 18 regional capitals we answer one question: will the weather in the next 24 or 72 hours favour dust being lifted from urban surfaces? Switch the sector and the horizon, hover over a city and you see the risk level and the surface dryness.
| Level | What it means |
|---|---|
| 1 | Wind too weak for significant lift |
| 2 | Moderate lift |
| 3 | Clear emission, worth monitoring |
| 4 | Dust episode conditions |
How we compute it
We fetch the weather forecast from two models, GFS and IFS (ECMWF), together with weather measurements from the past 7 days. History is essential, because how fast ground and dust dry out depends on the season and on moisture built up over the previous days. From rainfall, temperature, humidity and sunshine we compute how wet the surface is. Wind and gusts, in turn, let us estimate the strength of turbulence right above the ground and the risk of dust being lifted. The amount of dust lifted grows with the cube of the wind speed right above the ground (Loosmore and Hunt, 2000), and evaporation follows the FAO-56 equation.
What the map does not replace
This is a city-wide forecast. It is based on meteorology and typical surface parameters only, not on monitoring at a specific place. The 1–4 thresholds are our own estimates. A particular site or terminal has its own ground, shelter and work schedule, so for a single location we calibrate the model on site and combine it with dust monitoring from YetiBox stations.
For your location
We build forecasts for a single address on request, with e-mail or SMS alerts when the risk passes an agreed level. The method is similar to the one used in our dust risk forecast for ports and bulk terminals.
The port example shows what such a message can look like. Every day at 6:00 the client receives an e-mail with the risk level for three days, hour by hour, with a PDF report and hourly XLSX data attached.
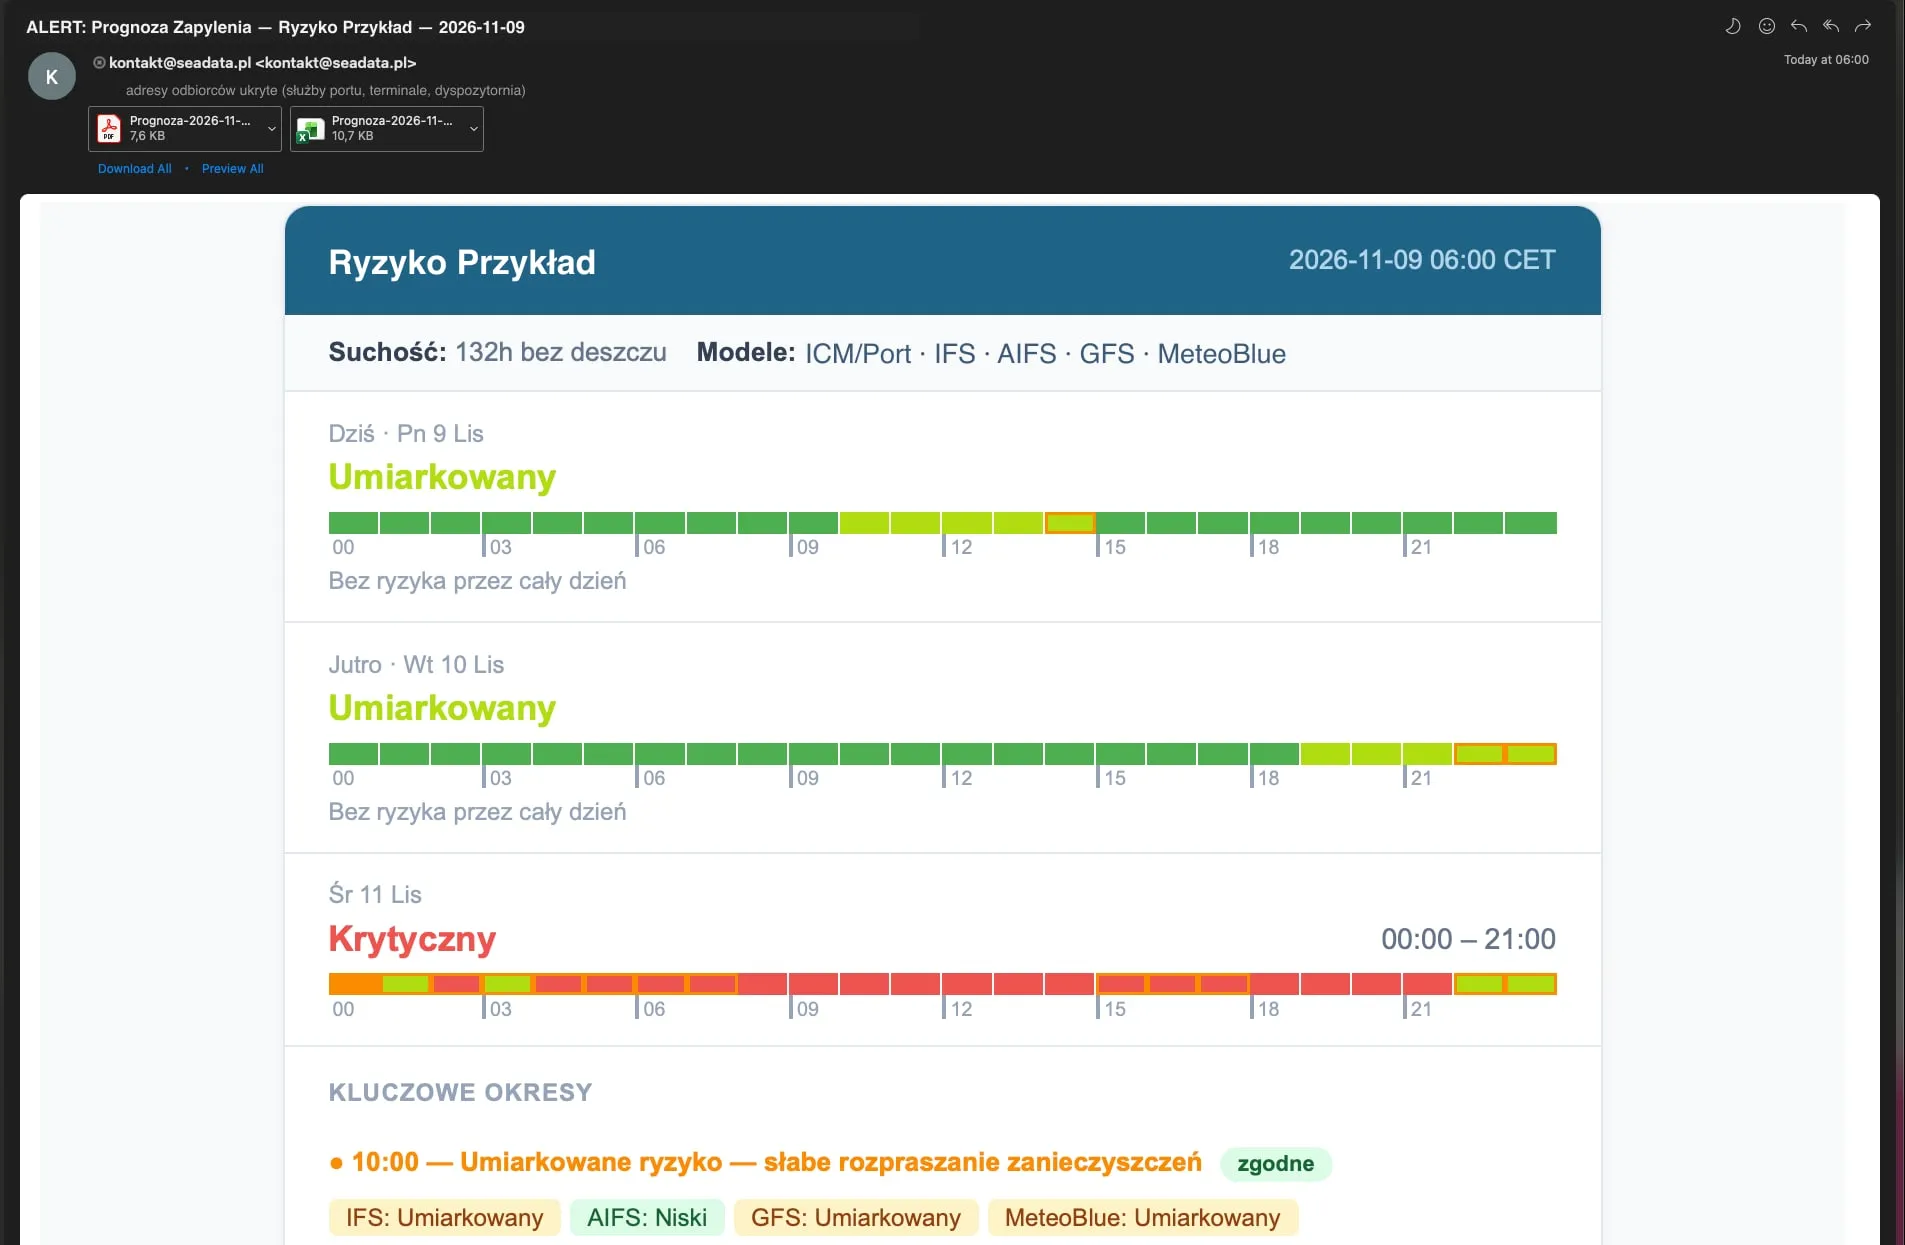
Example from the port forecast: a daily e-mail with three-day risk, a PDF report and XLSX data attached (in Polish). For a construction site or logistics yard the message looks the same.
Updated every day
The forecast runs automatically each morning on the latest weather model data. Open the map and see today's situation straight away.
Two sectors
Construction means exposed soil, sand and aggregate. Logistics means dust settled on the asphalt of yards and roads. The same weather forecast, but different local conditions.
A 1–4 scale and dryness
The risk level of the worst hour in the forecast and the share of time the surface is dry. Two numbers you can turn into a decision about spraying.
Two models, the worse result
We compute risk separately from the American GFS and the European IFS forecast and show the higher of the two. We believe it is better to warn the client and leave the final decision to the local inspector.
What it looks like on the map